|
Week of October 28, 2002 Snapshot from the Field |
|
LOOKING FOR A PREVIOUS STORY? CHECK THE ARCHIVE.
Study: Riverside, Calif., Sprawl Highest, NYC Lowest 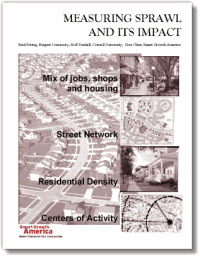
Urban Sprawl:
New Smart Growth America Study Moves to Measure Elusive Location Factor by JACK LYNE, Site Selection Executive Editor of Interactive Publishing
WASHINGTON, D.C. – Urban sprawl is an increasingly influential site-selection factor – either as an obstacle to avoid or overcome, or as a catalyst for community opposition. But getting a clear picture of sprawl has often seemed a bit like U.S. Supreme Court Justice Potter Stewart's description of pornography: Most people would be hard pressed to define the concept, but they think, at least, that they know it when they see it.
Now, a new research effort may add some long-missing meat to flesh out a quantification of urban sprawl. Smart Growth America (SGA at www.smartgrowthamerica.com), a Washington, D.C.-based advocacy group, has just released the results of a three-year study that ranked urban sprawl in the 83 largest U.S. metropolitan regions. (Collectively, those 83 metro regions contain about half of the U.S. population.)
"For the first time we are able to define sprawl objectively, so we can see how it measures up," said Don Chen, SGA executive director. So where does sprawl measure up in its most pronounced form? The three metro areas with the greatest sprawl, at least according to the SGA study, are Riverside-San Bernardino, Calif.; Greensboro-Winston-Salem-High Point, N.C.; and Raleigh-Durham, N.C., respectively. (See accompanying chart.) And where is sprawl least pronounced? The three metros with the least sprawl, according to the SGA study, are, respectively, New York; Jersey City, N.J.; and Providence-Pawtucket-Woonsocket, R.I. (See accompanying chart.)
The study employed a wide-ranging methodology that reaches considerably beyond most previous efforts to quantify sprawl. Coordinated by Rutgers University's Reid Ewing, Cornell University's Rolf Pendall and SGA's Chen, the research measured 22 different factors. Those 22 variables are based in the four different aspects of metro development that define sprawl - at least according to the researchers. Those characteristics are: diffusion or concentration of housing and population; segregation or integration of homes vis-�-vis activities of daily life; the lack or presence of strong economic and social centers; and the connectedness or disconnectedness of street networks.
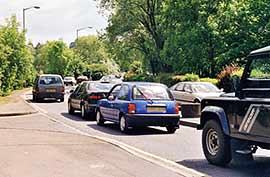
And the research's selection of variables, the researchers asserted, also delineates what sprawl isn't: "Most of the other features usually associated with sprawl - the lack of transportation choices, relative uniformity of housing options or the difficulty of walking - are a result of these conditions," the study's authors wrote. The SGA study, however, will perhaps raise as many questions about sprawl as it answers. Those questions will be based in part on the strong advocacy agendas that are the raison d'etre for most of the some 60 groups in the coalition that that created the SGA. The SGA coalition, for example, includes: the Conservation Fund; the Environmental Justice Resource Center; the Growth Management Leadership Alliance; the National Neighborhood Coalition; the Natural Resources Defense Council; the National Trust for Historic Preservation; the National Wildlife Federation; the Sierra Club; and the Trust for Public Land. Sprawl and Death on the Highway Nonetheless, even with advocacy-related questions raised, the Measuring Sprawl and Its Impact study provides some interesting quantifications of urban sprawl.Among those quantifications: Sprawl may be hazardous to your driving health: Traffic fatalities are 50 percent more common in highest-sprawl areas than in lowest-sprawl areas, researchers reported. The 10 areas with the highest "Sprawl Index Scores" averaged 36 traffic deaths per year for every 100,000 people. The 10 areas with the lowest Sprawl Index Scores averaged 23 deaths per 100,000 people. Sprawl makes people wish for frequent driver miles: Residents of highest-sprawl areas drive 10 miles (16.1 kilometers) more per day than residents of lowest-sprawl areas, the study found. And high-sprawl areas have more cars and more drivers: The ten highest-sprawl areas average 180 cars for every 100 households, compared to 162 cars for every 100 households for the 10 lowest-sprawl areas, the report noted. Sprawl is also something in the air: "The degree of sprawl is more strongly related to the severity of peak ozone days than per-capita income or employment levels," the study's authors wrote. Specifically, ozone pollution levels are as much as 41 parts per billion higher in areas with the highest Sprawl Index Scores, researchers reported. And that affects more than residents' well-being, the study said: "Failing to reach the federal health-based standard not only imperils the health of children and other vulnerable populations, but also subjects regions to a raft of rigorous compliance measures" - which can influence industry location choices. "What this study tells us is that sprawl has a direct and negative impact on our everyday lives," Chen said. 'Regions Can't Sprawl Way Out of Congestion' Sprawl doesn't ease traffic woes: The SGA study also challenges the notion that spread-out areas suffer from less gridlock than clustered metros."The research found that sprawling metros exhibited the same levels of congestion delay as other regions . . . and have fewer alternatives in travel routes and modes," researchers wrote. "This finding challenges claims that regions can sprawl their way out of congestion." A single part of the picture doesn't necessarily tell the whole sprawl story: Sprawl, the study underscores, is a complex statistical animal to track - so much so, in fact, that it may not really fit Justice Stewart's definition of pornography. An observer, for example, may know what he or she sees in one part of a metro, but that one part doesn't automatically define the whole sprawl story, the study's authors contend. Cases in point: Columbia, S.C., and Tulsa, Okla. - areas that the researchers labeled as part of "a mixed bag." "While the Columbia or Tulsa metro areas contain large swaths of low-density development, the presence of a number of strong centers brings them up in the overall ranking," researchers wrote. (Both metros scored near the middle in their Sprawl Index Scores, with Columbia ranked the 34th highest sprawl area, and Tulsa ranked 43rd.) Sprawl and "policy recommendations": Not surprisingly, the SGA study also comes with "six policy recommendations to reduce sprawl and promote smarter growth" for "regions wishing to improve their quality of life." Those recommendations include:
©2002 Conway Data, Inc. All rights reserved. Data is from many sources and is not warranted to be accurate or current.
| |||||||||||||||||||||||||||||||||||||||||||||||||||||||||||||||||||||||||||||||