| |
  
| FROM SITE SELECTION MAGAZINE, MARCH 2021 ISSUE |
 |
MARYLAND
Sudden digital advertising tax prompts lawsuit by big tech and friends.
|
|
 |
INVESTMENT PROFILE: Indiana Municipal Power Agency
Power from 32 solar parks puts more cash in industrial customers’ pockets.
|
|
| CONWAY ANALYTICS SNAPSHOT |
Data Centers Lead in REIT Employment
| FTSE Nareit sector |
Total REIT employment |
As % of total |
| Data center |
50,700 |
19% |
|||||||||||||||||| |
| Residential |
40,700 |
15% |
|||||||||||||| |
| Specialty |
32,200 |
12% |
||||||||||| |
| Storage |
22,700 |
8% |
|||||||| |
| Industrial |
22,600 |
8% |
|||||||| |
| Retail |
20,700 |
8% |
||||||| |
| Infrastructure and telecommunications towers |
18,200 |
7% |
|||||| |
| Office |
15,700 |
6% |
||||| |
| Timberland |
15,500 |
6% |
||||| |
| Diversified |
9,700 |
4% |
||| |
| Health care |
3,700 |
1% |
| |
| Lodging |
3,600 |
1% |
| |
| Total, equity REITs |
256,000 |
93% |
|
| mREITS |
18,000 |
7% |
||||| |
| Total direct REIT employment |
274,000 |
100% |
|
|
Table courtesy of EY based on data from Internal Revenue Service, S&P Global, and EY analysis
|
EY earlier this month released a 27-page report that finds the total economic contribution of U.S. real estate investment trusts (REITs) and related businesses in 2019 was an estimated 2.6 million full-time equivalent (FTE) jobs that generated $173.3 billion of labor income. That footprint consists of the direct operations of REITs and related businesses in the U.S., “as well as the induced or indirect flows from dividend and interest payments by REITs and REIT property improvement and construction investments,” said the report, prepared at the behest of Nareit. Among the findings, REITs invested $85 billion in new construction and routine capital expenditures to maintain existing property. They also paid $21 billion in property taxes.
The table above shows the top industry sectors for 2019. REIT employment impact by state follows population to a large extent, with some exceptions. We took it a step further by introducing the latest state population figures and determining per-capita REIT employment impact: Those rankings are listed below.— Adam Bruns and Daniel Boyer
Economic Contribution of REITs by State, 2019
| State |
Full-Time Employees |
Population 2020 |
REIT-Affilicated Employment Per 100K Residents |
Per-Capita Rank |
| Virginia |
156,000 |
8,684,166 |
1,796.37 |
1 |
| Nevada |
43,000 |
3,129,746 |
1,373.91 |
2 |
| New York |
225,000 |
19,825,692 |
1,134.89 |
3 |
| California |
426,000 |
39,648,525 |
1,074.44 |
4 |
| Massachusetts |
75,000 |
6,993,463 |
1,072.43 |
5 |
| New Jersey |
97,000 |
9,100,978 |
1,065.82 |
6 |
| Hawaii |
15,000 |
1,437,400 |
1,043.55 |
7 |
| Georgia |
108,000 |
10,746,984 |
1,004.93 |
8 |
| Arizona |
72,000 |
7,332,436 |
981.94 |
9 |
| Illinois |
113,000 |
12,862,980 |
878.49 |
10 |
| Colorado |
49,000 |
5,857,922 |
836.47 |
11 |
| Florida |
177,000 |
21,587,015 |
819.94 |
12 |
| Connecticut |
29,000 |
3,620,809 |
800.93 |
13 |
| Texas |
234,000 |
29,806,340 |
785.07 |
14 |
| Maryland |
47,000 |
6,109,921 |
769.24 |
15 |
| Washington |
59,000 |
7,741,427 |
762.13 |
16 |
| Mississippi |
22,000 |
3,056,560 |
719.76 |
17 |
| Montana |
7,000 |
1,096,002 |
638.68 |
18 |
| Oklahoma |
25,000 |
4,027,691 |
620.70 |
19 |
| Oregon |
26,000 |
4,281,589 |
607.25 |
20 |
| Pennsylvania |
76,000 |
12,991,367 |
585.00 |
21 |
|
|
  |
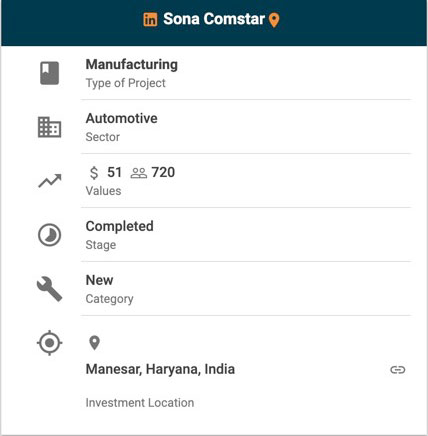
INDIA
As reported by The Economic Times and other Indian news outlets, this automotive component manufacturer has launched operations at this new manufacturing plant on a five-acre site to make differential assemblies and e-drive modules for global electric vehicle customers. The company just filed paperwork for an IPO last month. Sona Comstar supplies components to automotive OEMs across the U.S., Europe, India and China, for both electrified and non-electrified powertrain segments, and says it is not dependent on a single product, vehicle segment, customer or geography. Among its customers are Daimler, Mahindra & Mahindra, Maruti Suzuki, Renault Nissan and Volvo.
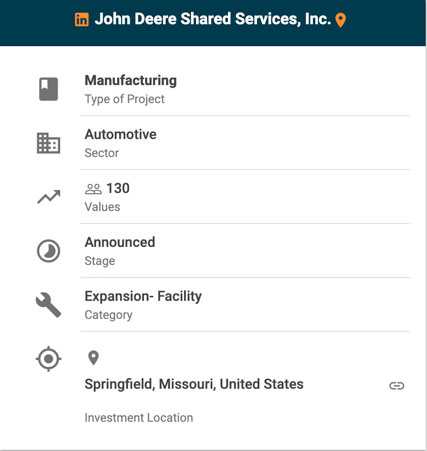
MISSOURI
In the self-designated remanufacturing capital of the U.S., John Deere & Company’s John Deere Reman division will add drivetrain and hydraulic remanufacturing operations to its existing facilities and add 130 new jobs to its current Springfield head count of 400. A state-issued press release explained that remanufacturing offers customers the opportunity to meet the service needs of their equipment at a lower price point, with quality equivalent to new parts. The remanufacturing of components also has significant environmental benefits through the reuse and recycling of material. “By consolidating operations and creating a center of excellence in Springfield, the company is well positioned for future growth,” said Jena Holtberg-Benge, manager, John Deere Reman Business, which began in Springfield in 1998 as a joint venture with Springfield Remanufacturing Corp. and became wholly owned by Deere in 2009. The Springfield region is home to multiple remanufacturing companies and has seen significant growth from the industry over the past 10 years, drawing on resources such as Ozark Technical Community College’s Center of Advanced Manufacturing.
|
|
| KANSAS: PUNCHING ABOVE OUR WEIGHT |
 |
FOOD PROCESSING
While most operations are clustered in the Kansas City metro, food and beverage producers can be found across the state — including a $250 million project in Finney County that’s closer to Denver than K.C.
|
|
 |
LOGISTICS & DISTRIBUTION
Kansas is keeping apace of the new speed of delivery.
|
|
| SITE SELECTION RECOMMENDS |
|
The latest North American Data Center Trends Report from CBRE, released earlier this month, showed 329.6 MW of net absorption in 2020 across the seven primary U.S. data center markets. While down 11% from the peak in 2019, said CBRE, “2020 absorption was still higher than any other year on record. Meanwhile, vacancy fell to just 8.5% despite an 11% growth in new supply.”
“With data usage growing at an explosive rate, we expect data center demand to increase across both primary and secondary markets in 2021,” said Pat Lynch, senior managing director, Data Center Solutions, CBRE. In addition to the top 10 most active markets listed below, CBRE reported significant construction pipelines in such markets as Montreal (57 MW), Silicon Valley (50.1 MW), Central Washington (43.7 MW), Hillsboro, Oregon (40.5 MW), and Chicago (33.7 MW).
Top 10 Most Active Markets
|
Market |
2020 Absorption |
Market |
2020 Absorption |
Northern Virginia |
217.2 MW |
Phoenix |
17.5 MW |
Toronto |
38.1 MW |
Central Washington |
14.5 MW |
Dallas-Fort Worth |
33.7 MW |
Chicago |
13.1 MW |
Silicon Valley |
26.6 MW |
Montreal |
11.0 MW |
Atlanta |
18.2 MW |
Seattle |
6.9 MW |
The county board of supervisors in Loudoun County, the northern Virginia county that is home to the world’s largest concentration of data centers, recently passed a resolution to declare March 24 (yesterday) as International Data Center Day in Loudoun County. Among the events planned were the presentation of 1,000 Data Center Day challenge coins in recognition of the critical services provided by data center workers during the COVID-19 lockdown; and the debut of a podcast series “It’s called a DAY-TUH Center” with Buddy Rizer, which takes an in-depth look at the history, impact and future of the industry in Loudoun. “For those in tech industries, Ashburn is on-par with major cities like New York, London, Frankfurt and Hong Kong for global economic impact,” said Rizer. Even though the buildings are easily seen, we want to convey to our community that the full impact of the industry goes beyond the buildings. That includes the hundreds of millions of dollars in annual tax revenue, the thousands of jobs for Loudoun residents, and a great deal of community service performed by those in the industry.”
|
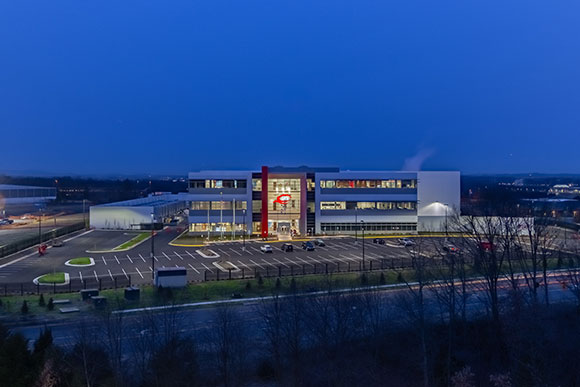 |
One of the many data centers in Ashburn, Virginia, that have helped make Loudoun County the data center capital of the nation Photo courtesy of Loudoun County
|
|

|
|
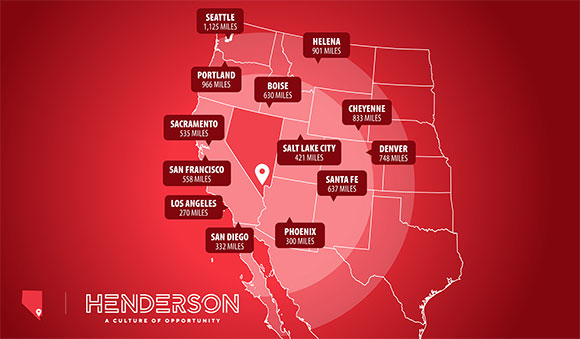
Henderson, Nevada’s pro-business environment supplies industry with a wealth of competitive advantages in lower costs, strategic location and logistics, robust workforce and an abundantly affordable quality of life.
In a state with zero personal and corporate income tax, this business-friendly city further reduces costs with the region’s lowest property tax rates as well as utility costs 30% below average. Since Henderson’s Southern Nevada location and I-15 transit allow an eight-hour turnaround to California ports, shippers can enjoy California advantages at a significant decrease in costs and regulation.
Henderson also connects business to a rapidly growing population of 2 million within a 30-minute radius and to a powerful talent pipeline assuring world-class workforce performance. Greater satisfaction and engagement are supported by lower comparable costs in housing, vibrant city life and spectacular outdoor recreation.
Explore Henderson’s advantages by visiting https://hendersonnow.com/, or by contacting Derek Armstrong, Director of Henderson Economic Development and Tourism, at (702) 267-1650 or email derek.armstrong@cityofhenderson.com
|
|
 |
Photo courtesy of The Des Moines Register
|
|
After having to postpone last year’s edition, the famous Register’s Annual Great Bike Ride Across Iowa (RAGBRAI) announced earlier this month it’s back on for 2021. The week-long ride — RAGBRAI XLVIII — will take place July 25-31, beginning in the ice cream capital of Le Mars out west and ending with a dip in the Mississippi in Clinton, Iowa, which took home the No. 1 per-capita ranking this year in Site Selection’s annual analysis of the Mississippi River Corridor. This photo from the 2019 ride was among several provided to Site Selection by the RAGBRAI team at The Des Moines Register last year for our Iowa Spotlight, which followed the planned route even though no cyclists ended up doing so. Ride on!
|
|
|
|