
Chicago Mayor Brandon Johnson is fond of quoting the Sermon on the Mount from the Gospel of Matthew in explaining how he champions economic development in historically underinvested areas of his city: “Where your treasure is, there your heart will be also.”
Judging by the treasure of corporate investment pouring into his city and all of Chicagoland, the economic heart of this globally connected heartland region is beating like never before — even if a particular Interstate artery was just named the most congested truck bottleneck in America.
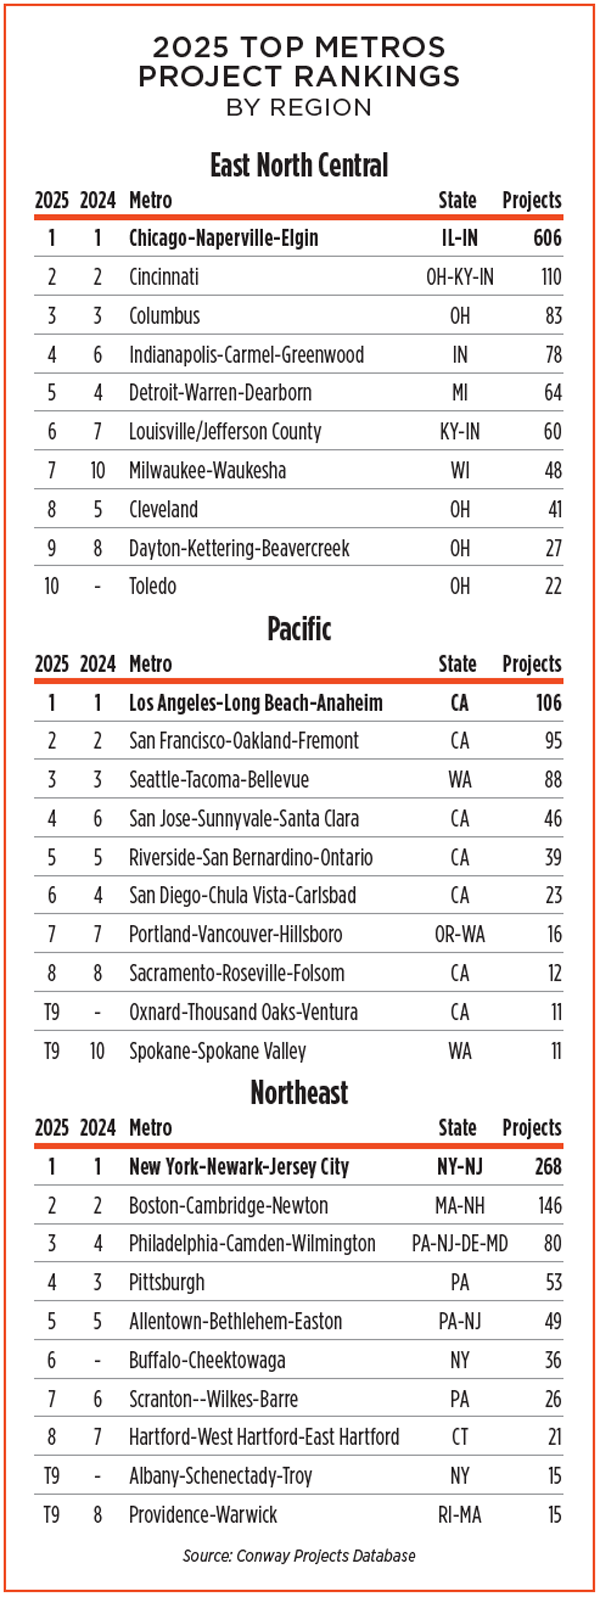
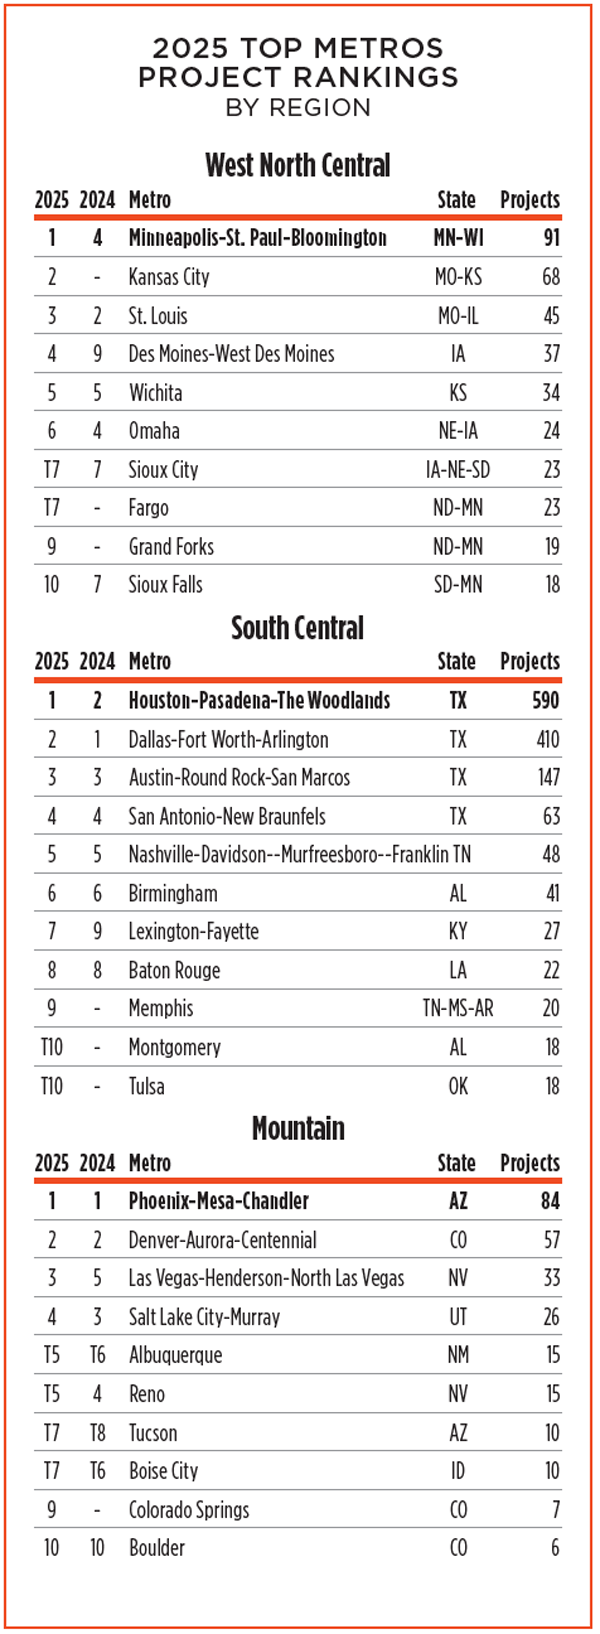
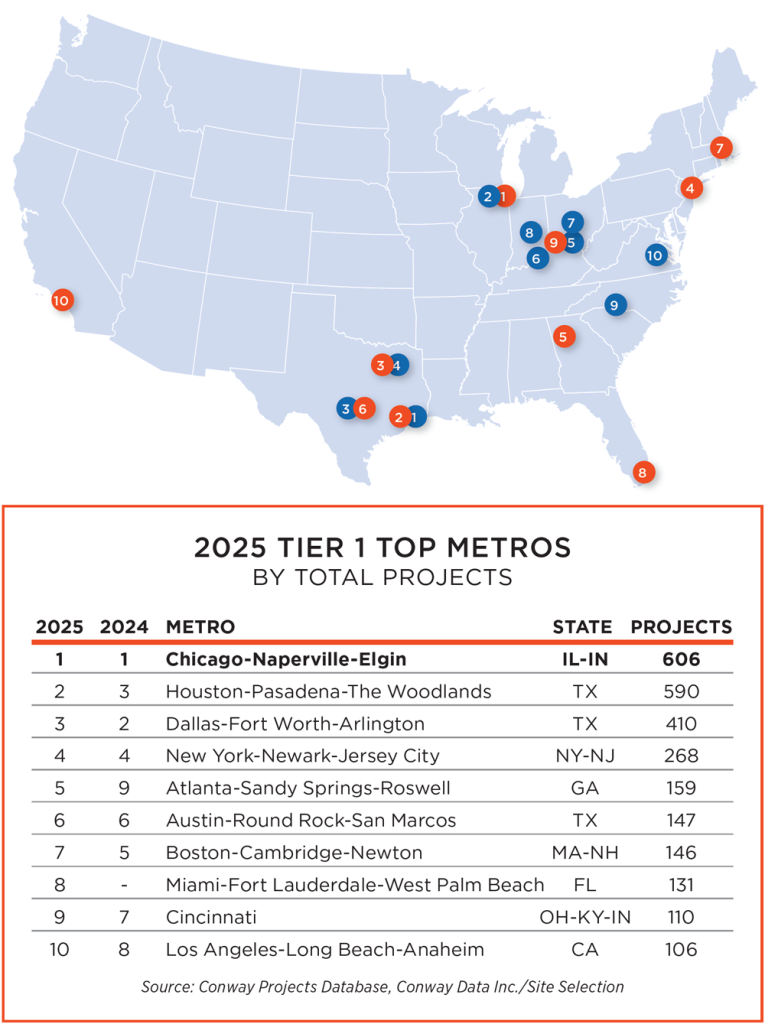
With more than 600 corporate end-user facility projects qualified for Site Selection’s Conway Projects Database in 2025, Chicagoland once again ranks No. 1 in the nation, just ahead of Greater Houston (590 projects) and Dallas-Fort Worth (410). So, with apologies to commuters, it’s fair to say that with those kinds of numbers, traffic comes with the territory.
“Where your treasure is, there your heart will be also.”
— Brandon Johnson, Mayor of Chicago, citing the Sermon on the Mount
It’s also fair to say that one reason the Chicago-Naperville-Elgin, Illinois-Indiana, CBSA territory is a perennial winner is the vast geography it gets to count as its own: When your footprint covers more than 10,000 square miles home to 9.4 million people, opportunities to hang up or upgrade your shingle are plentiful.
Andrew Hayes, vice president of marketing communications for World Business Chicago, says the metro area’s performance reflects “a region that continues to deliver what companies need most: connectivity, talent, space, and long-term economic stability. World Business Chicago’s primary KPI — the Pro-Chicagoland Decision (PCD) — tracks relocations and expansions that are fueling growth across the metro. This past year, PCDs increased 40% year over year, generating nearly 19,600 jobs, $1.7 billion in earnings, and more than 26 million square feet of new or expanded space.
“This momentum is not accidental,” he says, citing the region’s global connectivity and diversified economy. “It is the result of a region with unmatched logistics power, a diversified and resilient economic base, and a nearly five-million–person workforce spanning advanced research to essential operations. Add to that over 150,000 students entering the regional economy each year, competitive utilities, abundant water, scalable industrial space and a deliberate focus on vibrancy as an economic driver — and you have a market built for sustained corporate growth.”
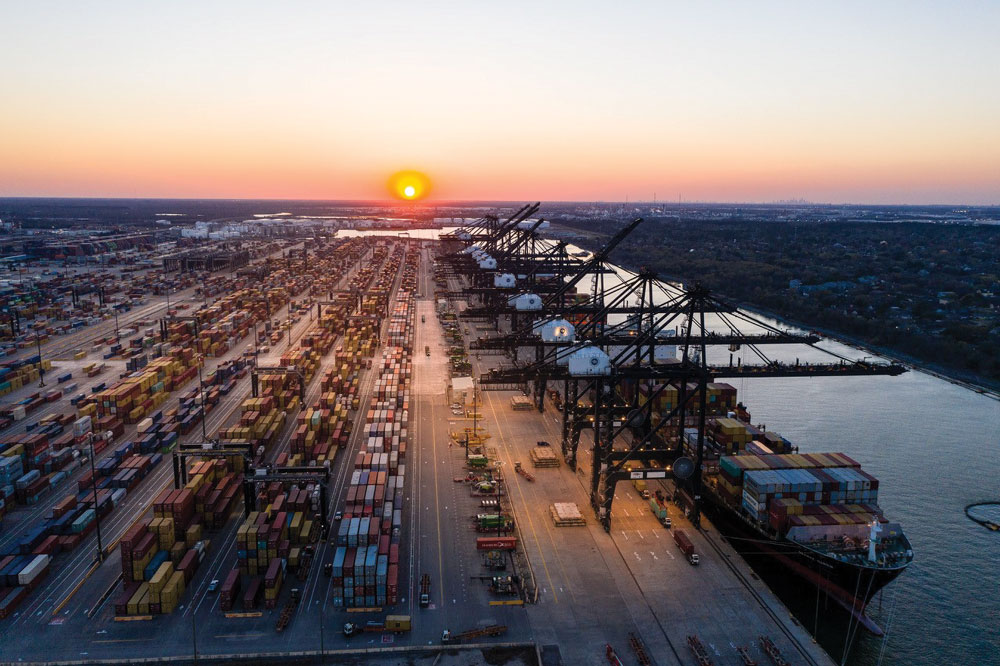
Supported by infrastructure like the Port of Houston, in Site Selection’s Top Tier-1 Metro by Projects Per Capita, Texas has ranked as the top exporting state in the country for the past 24 years.
Photo courtesy of Port Houston
The most dynamic
upward mover was
metro Atlanta, rising
by four spots from No.
9 last year to No. 5 this
year with 159 projects.
Top-line notes from Tier 1 (population of 1 million or more) include:
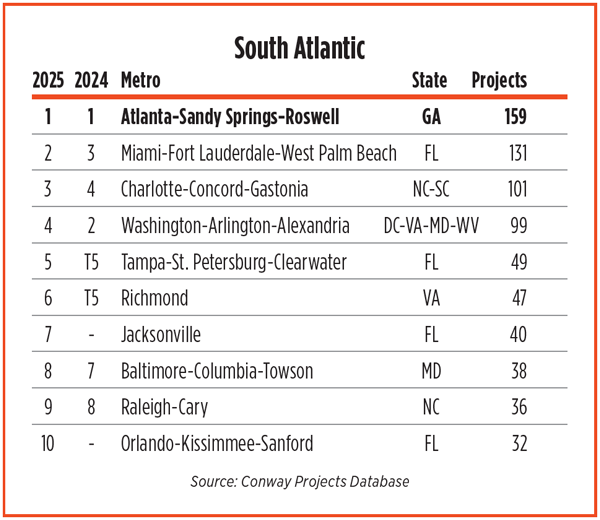
- The only new entrant in the top 10 this year was metro Miami coming in at No. 8 by overall facility count with 131 projects.
- The most dynamic upward mover was metro Atlanta, rising by four spots from No. 9 last year to No. 5 this year with 159 projects.
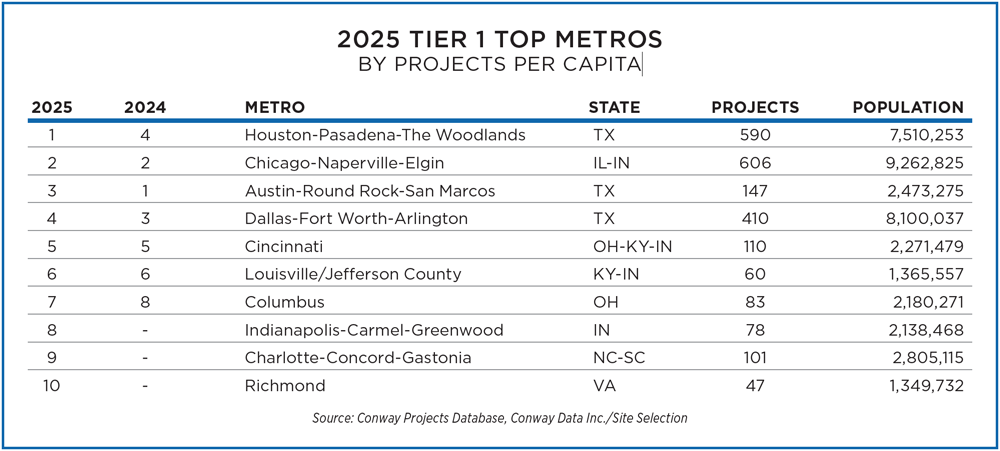
- In the per-capita category, metro Houston and its 590 projects rose by three spots to capture top honors. Chicagoland places second, no small feat for a large population.
- Three metros in the top 10 per capita were not on the list last year: No. 8 Indianapolis, No. 9 Charlotte and No. 10 Richmond, Virginia.
How do our Tier 1 Top Metros compare to analyses performed by others? One interesting index to study is Milken Institute’s just-released Best-Performing Cities 2026 report, which separates rankings into Large Cities and Small Cities and, crucially, examines the smaller MSA designations rather than the CBSAs analyzed by Site Selection. The report does not measure facility investment, but such factors as wage and job growth, high-tech GDP, broadband access, housing affordability and economic inequality (via the GINI index). So, it’s not a stretch to say metros ranking highly on their lists and Site Selection’s may be in a particular sweet spot.
Site Selection Director of Programming and Analytics Daniel Boyer cross-indexed the two indices and found that, among Tier 1 metros, only one metro made top 10 in both rankings: Austin-Round Rock-San Marcos, Texas. The next-highest-scoring metros from either of our Tier 1 Top 10s are Indianapolis-Carmel-Greenwood Indiana (No. 8 in our per-capita rankings and No. 17 among Milken’s large metros); Charlotte-Concord-Gastonia, North Carolina-South Carolina (No. 9 per capita, No. 23 according to Milken) and Dallas-Fort Worth-Arlington, Texas, which is Site Selection’s No. 3 metro overall and No. 4 metro in projects per capita and ranks No. 35 on Milken’s list.
Today and Tomorrow
The Chicago MSA finishes in the high 100s on Milken’s list but the larger Chicagoland CBSA is No. 1 on Site Selection’s ranking, which often has proved to be a leading indicator for later improvement across some of the factors Milken measures. Notes from the “Chicagoland by the Numbers” report released by World Business Chicago and the three-year-old, seven-county Greater Chicagoland Economic Partnership last August provide good reasons for optimism:
- 2024 saw the region’s gross regional product value grow to $886 billion, 27% higher than in 2019 and ranking in the lower 20s among the world’s largest economies. The year also saw $4.32 billion invested in Chicagoland startups, firms joining a total regional count of 252,322 businesses.
- As of April 2025, the region had a workforce of 5 million.
- Food, manufacturing, finance and insurance, and logistics lead the way in workforce and revenue in the region, an industry distribution reflected in Site Selection’s project data.
There’s no resting on laurels in a place like Chicago.
“We are now implementing Chicago 2050, a plan built through extensive convenings with hundreds of business, industry and ecosystem leaders,” says Hayes. “The formal rollout began in 2025, and our first strategy, ChiForward, is already driving an active, coordinated push to attract capital and accelerate investment across Chicagoland.”
All told, more than 3,100 projects landed last year in the 30 metros listed among the top 10 by total projects in each of three population tiers. Which means Chicagoland was responsible for nearly 20% of the total. Big shoulders indeed.
Major Investors
One investor leaving a large footprint in Chicagoland is Amazon, which last year invested in three distribution centers in the region — one in Hobart, Indiana, and one each in Bolingbrook and Wilmington, Illinois, communities in the logistics hub known as Will County.
Toss in Amazon Web Services (AWS) and you see that the company’s investments are not only woven into nearly all communities, but are particularly evident in this year’s Top Metros: Our tallies show 38 Amazon facility investments across 19 of the 42 metro areas named across all three population tiers (while the cumulative and per-capita rankings have 60 slots altogether, 18 metros make both lists in their respective population tiers.)
Microsoft made eight data center facility investments across five Top Metros, half of those projects rising in West Des Moines, Iowa, with the rest located in Plano, Illinois (Chicago); Atlanta; Fargo, North Dakota; and Kenosha, Wisconsin.
Look across those 3,100 projects to find companies who are investing in multiple Top Metros and Chicago keeps popping up on the lists of locations chosen by such companies as CEVA Logistics, Rivian, US Elogistics (now known as CIRRO), Digital Realty Trust, DHL and UPS. Dallas-Ft. Worth, metro Atlanta and our No. 1 Top Projects Per Capita Metro Houston also are frequent favorites among these multiple-location investors.
Elevating and Expanding
The making of goods and the moving of goods and people are central to these leading metro economies. Major international airport operations are central to getting that done. Chicago is no exception and is well on the way to growing airport capacity to keep up with a perennially growing economy.
In February, the City of Chicago unveiled progress on The New Concourse D, a $1.3 billion gateway at O’Hare International Airport that is scheduled to be completed by 2028.
Designed by the Chicago-based firm of Skidmore, Owings & Merrill, in collaboration with Ross Barney Architects, Juan Gabrel Moreno Architects and Arup, The New Concourse D will introduce 19 new flexible gates, the city said. The project is part of the larger ORDNext plan reimagining O’Hare’s core terminals, which aims to deliver 14% more gate capacity, greater flexibility for hub carriers, and more lounges and amenities, while improving operational efficiency.
Why expand an already massive airport? Because No. 1 doesn’t sit still. In January, new FAA data showed that in 2025, 857,392 aircraft landed or took off from O’Hare — more than any other airport in America, including previous No. 1 Atlanta.
“This is more than a statistic, it’s a statement about Chicago’s momentum,” said Mayor Johnson. “From the runways of O’Hare to the neighborhoods across our city, Chicago is building, growing and leading. We are open for business, open to the world and once again setting the pace for the nation.”