M |
ost Fortune 1,000 companies view corporate real estate as a strategic asset. This means it plays a primary role, along with human resources, technology and information, in helping the company achieve its long-run goals and objectives. In 1993, the International Development Research Council’s (IDRC) first Corporate Real Estate 2000 Program report said, “We have concluded that a corporation’s real estate — its land, buildings, and work environments — is a powerful resource whose strategic value is just emerging.” (IDRC is now known as CoreNet Global.)

Today, corporate real estate’s strategic import is widely accepted. On Arthur Andersen’s Web site in February 2002, we read, “Corporate real estate should be viewed as a strategic asset that can impact corporate performance.” However, the difference between a company’s talk about real estate being strategic and its acting on the concept is that not all compare the efficacy and role of their corporate real estate operations to those of competing and other well-run companies.
These comparisons, commonly called benchmarks, can be expensive, time consuming and costly in terms of staff time dedicated to the project. But benchmark data is essential for steering the real estate group so that it supports the company’s growth along its strategic expansion path. The volume of phone calls and e-mails to IDRC staff requesting corporate real estate benchmarking data suggests many companies are just beginning the process.

Why is it inconsistent for a corporate real estate department to manage in the strategic interest of the company yet not benchmark its operations and results to other such departments? Here are several thoughts on this.
- Strategic assets are crucial to the company’s competitiveness. If corporate real estate is managed less well than at competing firms, the company will find it difficult to establish and maintain its competitive advantage.
- Without periodic comparisons, a real estate department will not know when it is losing ground against competitors.
- Periodic comparisons enable the participants to share management models and innovations that can help them all become more effective.
- The prospect of periodic comparisons motivates a department to stay at the cutting edge of practice so that it will compare favorably when comparisons are made.
If this is so, why don’t all corporate real estate departments routinely participate in benchmarking programs? Here are some possible reasons. Some executives acknowledge the value of periodic comparisons but begrudge the time and expense involved. So, they put it off. Others are so caught up in day-to-day survival they neglect this practice. Arrogance may play a part for some. And fear of looking bad in front of peers may affect others.
Tools for Portfolio Managers
Enhancing each IDRC member’s capability to contribute strategically to the success of the enterprise is a key goal of the organization. Recognizing that many corporate real estate departments are just entering the benchmarking process, in 2000 IDRC decided to assist them by publishing averages for six common benchmarking metrics. The data were not subjected to the scrutiny of a traditional benchmarking exercise, so to distinguish them we called them corporate real estate performance ratios. These were derived from data provided by members in IDRC’s annual member survey.

Each ratio is broken out first by global region, such as Asia, Europe and North America. Second, the ratios are viewed by industry sector: manufacturing, services, infrastructure and e-industries. These were defined as key IDRC membership groupings in the year 2000 research report, Profile of an Industry Leader. Third, each ratio is evaluated for up to 14 industries, such as financial services, telecommunications, insurance, computer & data services, and electronics. Fourth, each performance ratio is broken out into percentiles to enable readers to see where their company ranks compared to other member-survey respondents. The report’s methodology is derived from three sources: Benchmarking in the Corporate Real Estate Function (IDRC, 1991); Vital Signs: Using Quality, Time and Cost Performance Measures to Chart Your Company’s Future (American Management Association, 1993); and Decision Support (IDRC, 1995).
Next, we’ll look briefly at the six ratios’ definitions and how each can be used from a strategic management perspective.
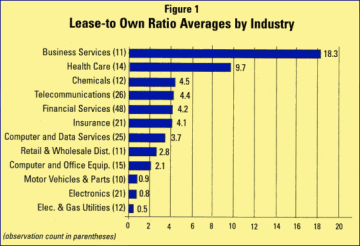
The lease-to-own ratio is calculated by dividing the square footage leased by the square footage owned for each company (see figure 1). The metric can be used to measure flexibility and cost associated with a company’s ability to adjust space holdings and arrangements. A company with a higher ratio may be able to make space adjustments faster and at a lower cost than a competing company with a lower ratio. The ratio is industry specific and usually has an appropriate range within which the company is best served.
Total corporate space per real estate employee is calculated by dividing the amount of leasable space (regardless of whether it is actually leased) by the number of real estate department employees. These are defined as professional and administrative personnel engaged in leasing, financial support, site selection, construction, facility management, design, workplace management and related activities. Staff-level employees were included, line-level excluded. Space per CREM employee can serve as a measure of CREM productivity. Departments with higher ratios may be more productive than those with lower ratios. The ratio is industry specific. Departments making effective and innovative uses of new technologies may have higher ratios than departments that do not.
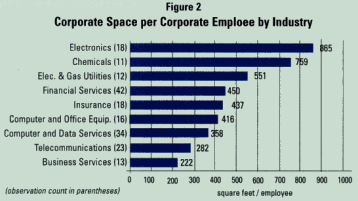
Space per corporate employee is defined as total leasable space divided by corporate head count (see figure 2). The measure can be used to compare how effectively competing companies manage their space assets. A company that pushes the ratio down over time can gain product-cost and flexibility advantages over a competing company whose ratio is static or rising. The ratio has an appropriate range for each industry and company. Pushing the ratio too low can make a company less competitive, especially in labor markets in which employee attraction and retention are difficult.
Sales per CREM employee is calculated by dividing publicly reported annual sales (or revenue for industries that do not report sales) by real estate department head count as defined above. The ratio can be used to compare the efficiency of real estate departments in competing companies. For example, if, other things being equal, company A’s ratio is $2 billion and competitor company B’s is $1 billion, the second firm needs to determine if the difference is justified. On the face of it, company A would seem to have a much more efficient corporate real estate capability. If a company’s ratio rises while the quantity and quality of CREM work remain the same, this is generally good. If the ratio for the CREM function rises more than the ratio for another corporate function, CREM is shown in a good light.
Traditionally, corporate planners scrutinized space per CREM employee to evaluate the function’s efficiency. But as the function evolves toward stronger workplace and customer-service orientations, the ratio of those serving to those being served by CREM is becoming more important. Corporate employees per CREM employee is an efficiency ratio that can be used in tandem with corporate space per CREM employee to compare one company’s real estate function to that of another. Other things being equal, a higher ratio suggests a more efficient CREM function.
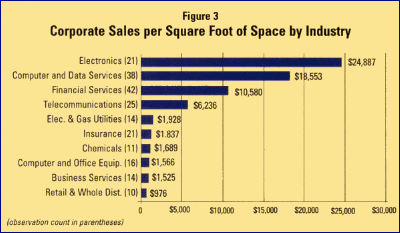
Corporate sales per square foot of space (leasable space) indicates how intensively a company uses space to generate revenue (see figure 3). Because firms in the same industry tend to use the same systems, processes and markets, firms in an industry tend to have sales-per-space values that vary within a range. Other things being equal, a higher value suggests a tighter, more efficient business model. In practice, of course, “other things” are rarely equal. Unexpected variations in this metric are usually due to different counting methods and errors in space measurement.
Consider the foregoing six corporate real estate metrics as starting points. See how your department and company stack up and decide whether conducting your own benchmarking exercise might help you understand your data’s placement on the percentile charts. Keep in mind that your department will probably need to track other metrics as well. Consult other benchmarking resources available on the Web – www.benchmarkingnetwork.com, www.apqc.com, www.ifma.org, www.isixsigma.com and www.amanet.org — to broaden your thinking on the subject and help you formulate your next steps.

