
It could stand for South, Southwest or both. But the S-shaped footprint of SXSW Center — the building in Austin, Texas, that’s home to the legendary South by Southwest Festival headquarters and all its offshoots — could just as easily stand for sustainability.
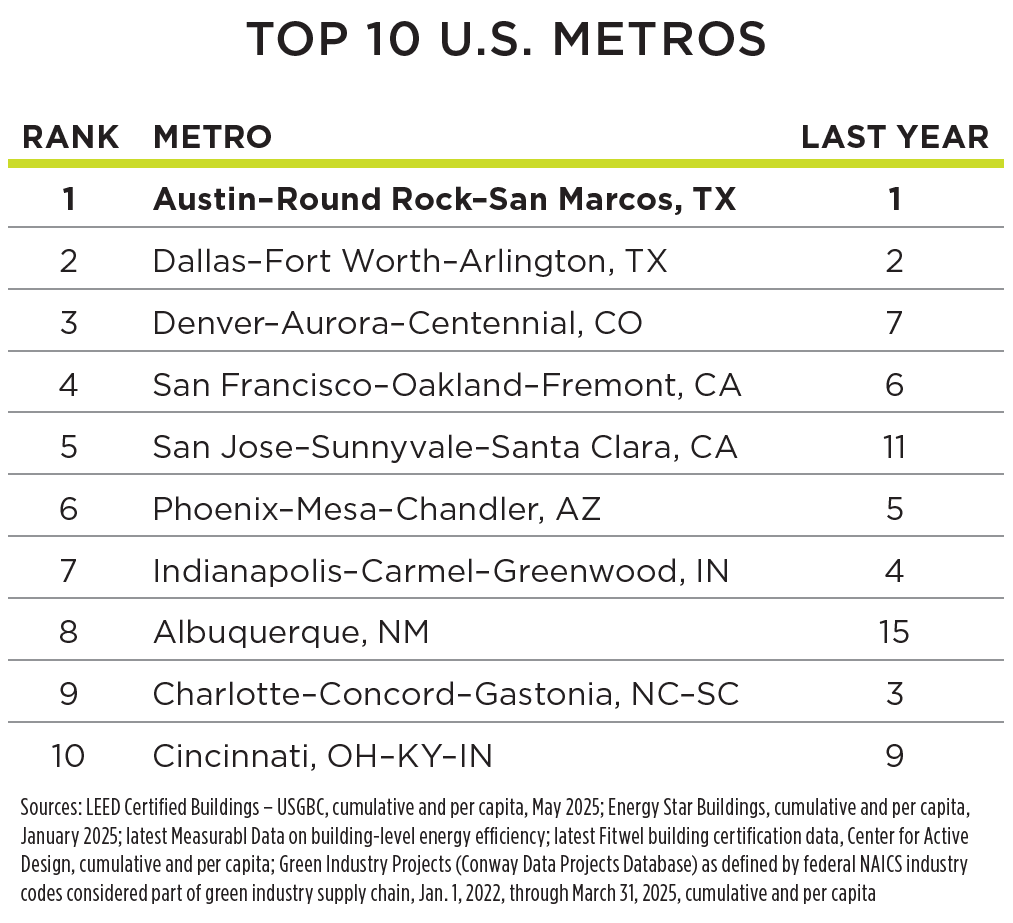
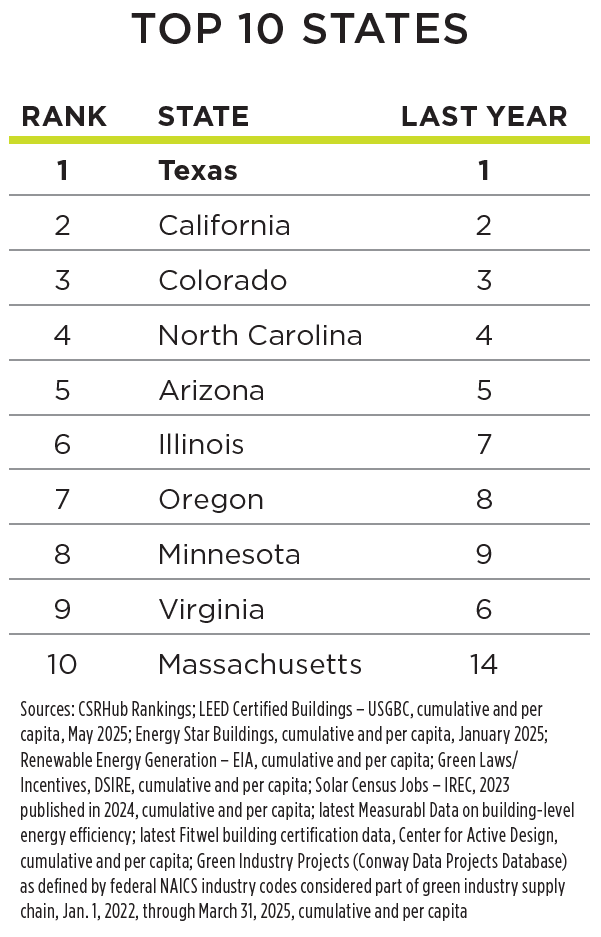
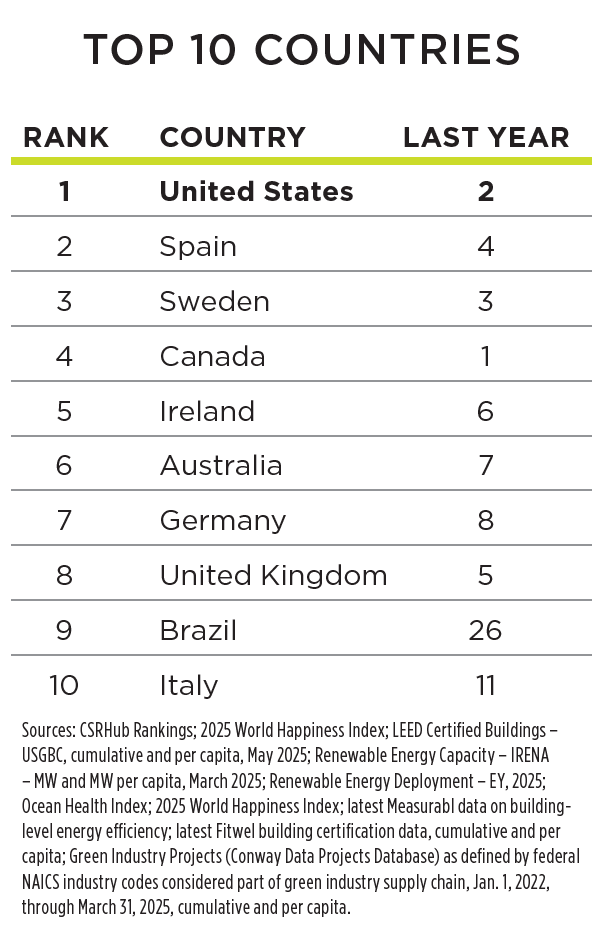
It only makes sense in a metro area and state that both find themselves once again atop the Site Selection Sustainability Rankings. Dallas-Fort Worth, Denver, the Bay Area and Silicon Valley join Greater Austin as the greenest U.S. metro areas. California, Colorado, North Carolina and Arizona fill out the top five states. The United States, Spain and Sweden top the country rankings, followed by Canada and Ireland.
“States and municipalities continue to be a strong driver in green building implementation, and Austin’s Energy Green Building code is a great example of how to ensure our schools, homes and offices are high-performance, healthy buildings,” says Tommy Linstroth, founder and CEO of SaaS provider Green Badger, whose software aids in automating and reporting LEED compliance and ESG metrics. “It’s no surprise to see them (and Texas) topping the list. The city’s far-reaching program ranges from creating a new market for construction waste diversion services to driving sustainable housing and places of education. By collaborating across city departments, local organizations and building professionals, they’ve developed standards that advocate for higher performance levels in the design and development industry.”
Now in their 16th year, our rankings reveal the territories cultivating the most fertile environment for a sustainability-oriented economy, based on a unique index incorporating such factors as green building square footage per capita, happiness, federal Energy Star certifications, manufacturing of renewable energy products, the degree of corporate social responsibility among area employers and the number of sustainability-oriented incentives and policies in place.
Unlike many green yardsticks, our index incorporates the “dirty” side of green industry too: We don’t just track where solar and wind energy are being produced, for example, but also — using NAICS industry codes labeled by the Bureau of Labor Statistics as associated with green industry combined with our own Conway Projects Database data on corporate facility projects — where the solar panels and modules, wind turbines and nacelles are being fabricated, assembled and shipped out. For this reason among others, the rankings have attracted interest from a number of arenas, including the Georgia Tech Scheller College of Business, where for multiple years I have delivered talks about the rankings and the broader subject of corporate sustainability in action to executive MBA program students.
Insights from Those in the Know
Partners and resources in this annual exercise include Measurabl, CSRHub, Fitwel (Center for Active Design), the U.S. Green Building Council, the Database of State Incentives for Renewables & Efficiency, the Energy Information Administration and the International Renewable Energy Council.
CSRHub tracks thousands of CSR actions and policies by corporations around the world, and for these rankings examines how Site Selection’s global corporate facility investment project data align with high-CSR companies. CSRHub Co-founder and Chief Technology Officer Bahar Gidwani says this year he saw “a lot more” matching than last year. “This suggests to me a general increase in awareness of sustainability matters,” he says, “and that entities are reporting more details on their progress.”
The findings come against a backdrop that shows, despite high interest rates and geopolitical volatility, the transition to clean energy continues. Based on a survey of 1,400 senior energy transition investors across 36 countries and 11 industries, a KPMG report released in June reveals that investment in clean energy assets rose from $1.2 trillion in 2020 to over $2 trillion in 2024.
Agencies such as the U.S. Environmental Protection Agency are looking at outsourcing such programs as the ENERGY STAR certification program. Congressional proposals include eliminating energy efficiency tax credits. An April report from The Conference Board found that enacted and proposed tariffs and federal policies could post challenges to corporate ESG and sustainability strategies in the form of higher costs for clean energy inputs; project delays; and higher investment risk due to potentially reduced incentives. Yet multinationals the world over continue to pursue their corporate social responsibility (CSR) and environmental, social and governance (ESG) goals, and industry organizations continue to advocate for the sustainability of sustainability itself.
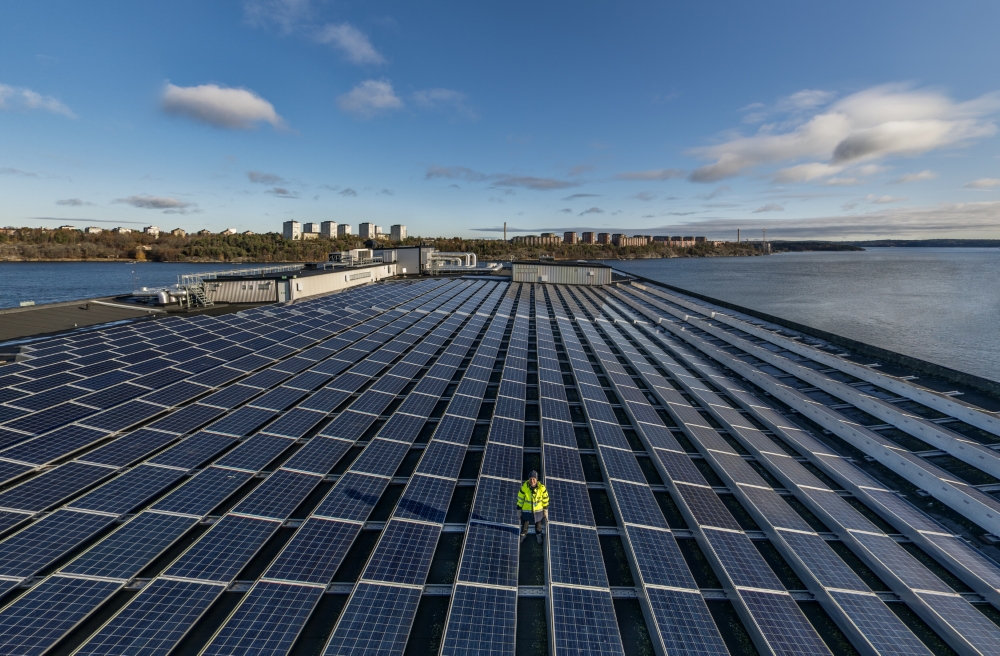
In addition to placing No. 3 in this year’s rankings, Sweden in June topped the World Economic Forum’s 2025 Energy Transition Index. As of 2022, more than 60% of Sweden’s electricity came from renewable sources.
Port of Stockholm photo by Jann Lipka/imagebank.sweden.se
“The ENERGY STAR Portfolio Manager plays a crucial role in standardizing energy efficiency data, which is critical to track progress and comply with regulations,” said Mary Lue Peck, president and COO of Building Owners and Managers Association (BOMA) International, in a June letter to Congress. “Without it, cities and states would most likely implement a fragmented approach, making compliance much more difficult and expensive.”
Meanwhile, the Phoenix-based American Clean Power Association (ACP), in its new “State of Clean Energy Manufacturing in America” report, finds that the sector contributes $18 billion to U.S. GDP annually, spurs $33 billion in domestic spending annually and supports 122,000 American jobs.
The report, released in May, finds that over 800 manufacturing plants currently contribute to the U.S. clean energy supply chain, with at least one in every state, and that 200 existing manufacturing facilities are actively building primary clean power components across 38 states. If all announced manufacturing facilities become operational, clean power manufacturing is projected to support over 575,000 jobs and contribute $86 billion annually to GDP by 2030, ACP states.
In keeping with the geographic scattergram of Site Selection’s rankings, employment from existing and planned facilities by 2030 by region is projected to be highest in the western U.S. (173,000+ jobs), followed closely by the South (172,000+) and the Mid-Atlantic (86,000+).
“Surging clean energy deployment is creating new manufacturing facilities across the country. This success will create hundreds of thousands of jobs and revitalize American communities if policy leaders place economic progress over partisan division,” said Jason Grumet, CEO of ACP. “Today’s report shows that the manufacturing activities across the clean energy sector drive a ripple effect of economic growth that extends far beyond factory walls, reaching every corner of the country. Reshoring this critical supply chain requires a shared commitment by both industry and policymakers to prioritize domestic economic growth and global competitiveness.”

Sunset in Austin, Texas
Photo by Christopher Sherman courtesy of Greater Austin Convention & Visitors Bureau

Sustainable practices are at the core of Texas Farmers’ Market at Mueller, held every Sunday on Philomena Street in Austin.
Photo by Julia Keim, Texas Farmers’ Market, courtesy of Greater Austin Convention & Visitors Bureau
Site Selection data partner Measurabl, whose work tracks building-level energy efficiency for clients, issued bulletins earlier this year about ways to preserve ENERGY STAR data. And the company published its inaugural Measurabl Intelligence report titled “The Business of Sustainability: U.S. Real Estate in 2025,” which stated, “Sustainability is no longer a box to check — it’s essential for success in real estate where performance drives business outcomes.” The report used Measurabl’s proprietary software and data sets to analyze energy use and carbon emissions intensity trends across seven U.S. property types from 2019 through September 2024, encompassing 14,528 properties and 22,772 spaces within buildings. Among its findings:
- Carbon reductions are outpacing energy efficiency improvements by 4 to 9 percentage points, depending on property type, “suggesting the growing impact of power grid decarbonization and renewable energy integration.”
- Office energy use showed the steepest decline at 25% since 2019, while warehouse energy use declined by 24% and manufacturing energy use declined by 5%. “Remote work and energy upgrades have reshaped office building performance, creating a new baseline for efficiency,” Measurabl stated.
- At the state level, Illinois leads with a 34% reduction in overall energy use. Virginia and Washington, D.C., each achieved a 26% decrease, followed by New York at 24%. California and Texas — No. 2 and No. 1 in Site Selection’s rankings — showed energy use reductions of 18% and 17%, respectively. In office energy use alone, Illinois led again with a 34% reduction, followed by our No. 3 Colorado with a 27% reduction.
What’s the benefit of energy efficiency? “If all existing commercial buildings in the U.S. were retrofitted with energy efficiency upgrades in compliance with their respective states’ current energy code,” the report stated, “$314 billion of tax deductions could be recognized, resulting in $66 billion in net total tax savings.”
Several company case studies noted that BXP had realized $5.3 million in demand-response payments through a program and $2.2 million in cumulative avoided energy expenses between 2017 and 2024. “Organizations that integrate sustainability into financial models will gain a competitive edge, improve operational efficiency, and attract capital,” Measurabl said. “Sustainability is no longer a cost — it is a value driver that defines long-term success.” And data is at the center: “This is the future of real estate: objective data over vague commitments, asset-level insights over broad corporate disclosures, and verifiable performance over proxies.”
The granular data points behind the Site Selection Sustainability Rankings couldn’t agree more.