
by Adam Bruns, Christopher Steele and Scott Brown
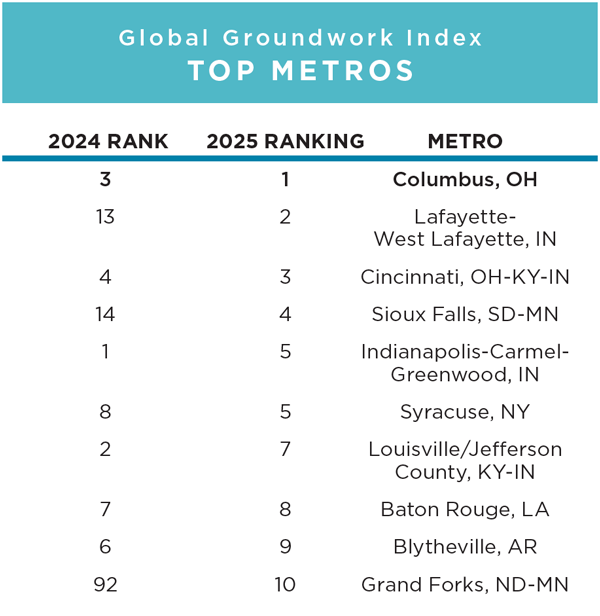
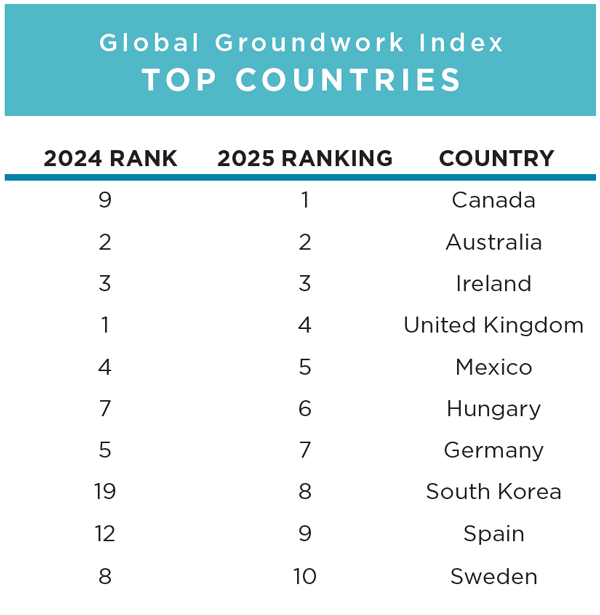
Taking in all the corporate data since 2021 (number of projects, capital investment and jobs) and the most current infrastructure funding data, Site Selection Director of Programming & Analytics Daniel Boyer crunched the numbers on a cumulative and per-capita basis to determine the Top 10 U.S. states, Top 10 U.S. metros and Top 10 countries outside the United States in the 2025 Global Groundwork Index.
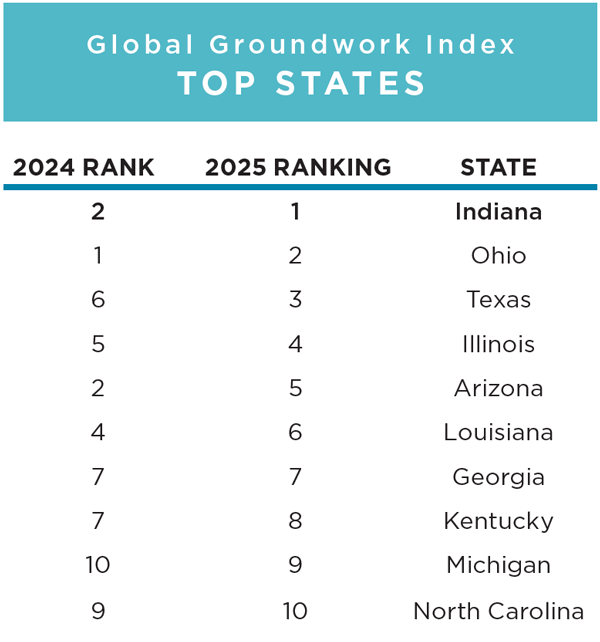
After running 1-2 for two consecutive years, Ohio and Indiana switched places this year, with the Hoosier State coming out on top, followed by Ohio, Texas, Illinois and Arizona. Texas, driven by the same impressive employer investments, transportation and energy projects and talent attraction that have won the state plaudits in this publication and elsewhere, made the biggest move up among the top 10, from No. 6 to No. 3.
Among metros, four of the top five involve the top two states, as Columbus, Ohio, and Lafayette-West Lafayette, Indiana, take the top two spots with the tri-state Cincinnati region taking third, the Indiana state capital of Indianapolis in fifth and Sioux Falls, South Dakota, sliding in at No. 4.
Among countries, Canada jumps up from No. 9 last year to No. 1, followed by Australia and Ireland maintaining their ranks achieved last year at No. 2 and No. 3 respectively.
The Indianapolis International Airport (IND), a crucial element in Indiana’s infrastructure for business, set an all-time new record on Memorial Day 2025 with 23,473 passengers. “A sold-out Indy 500, the Pacers’ playoff run and expanded nonstop service all contributed to this record-setting day,” said Marsha Wuster, Indianapolis Airport Authority senior director of commercial enterprise.
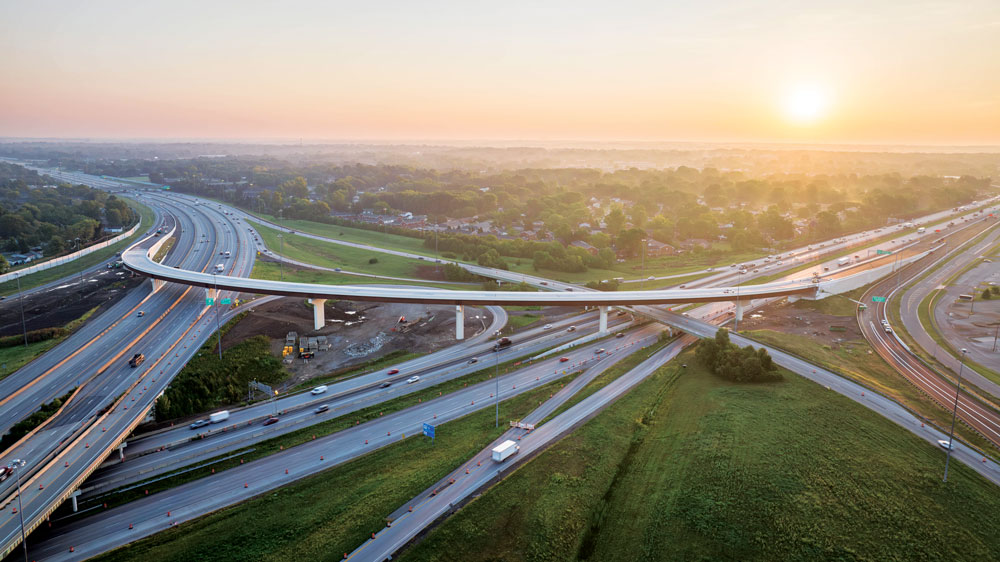
Part of the Ohio Department of Transportation’s $76 million interchange project, a new I-270 south to I-70 east flyover ramp opened in August in Columbus, ranked No. among metros in this year’s Global Groundwork Index.
Photo courtesy of Ohio DOT
In May alone, new flights launched out of Indy to Austin on Delta Air Lines, Atlanta, Charlotte, Dallas and Los Angeles on Spirit Airlines, Portland on Allegiant Air and Dublin, Ireland on Aer Lingus. In addition, Air Canada relaunched its daily service to Toronto, Canada.
Ohio may be No. 2 in this year’s index after two straight years at No. 1, but it’s still No. 1 in CNBC’s estimation, as the network’s “Top States for Business” ranking released in July awarded the Buckeye State top billing in the infrastructure category due in large part to its ready-to-build sites supported by the All Ohio Future Fund and Ohio Site Inventory Program. The ties between transportation and employer growth were at the heart of a June announcement by Ohio Governor Mike DeWine, Lt. Governor Jim Tressel and Ohio Department of Transportation (ODOT) Director Pamela Boratyn awarding $8.9 million in Transportation Improvement District Program funding to support 26 projects in 19 counties. “The roadwork projects will provide access to developable land, create easier access to existing businesses and alleviate traffic congestion around commercial areas,” said an ODOT release, noting the projects are expected to support more than 19,400 jobs and more than $3 billion in private sector capital investments.
“It’s hard for any business to succeed without road infrastructure to get people to and from their site,” said Lt. Governor Tressel.
Methodology for Top States and Top Metros: Cumulative and per-capita calculations based on Conway Projects Database projects, project-affiliated job creation and project-affiliated capital expenditure, Jan. 2021 through July 1, 2025. Cumulative and per-capita calculations based on project and funding data from the Bipartisan Infrastructure Law (BIL) Maps Dashboard. Retrieved from https://d2d.gsa.gov/report/bipartisan-infrastructure-law-bil-maps-dashboard
Made in America — But Where?
This year, in the first of a two-part series examining the convergence of investment data, infrastructure, tariffs and FTZs, Christopher Steele, CEO and president of economic analysis and research firm EBP US, and his colleague Scott Brown, senior analyst, offer this commentary that incorporates Global Groundwork Index findings into the larger site selection context as companies deal with shifting supply chains and shifting policies:
For the last four decades, U.S. infrastructure investments have prioritized offshoring, expanding ports, intermodal hubs, and just-in-time, last-mile distribution. Meanwhile, domestic manufacturing capacity and its requisite infrastructure have fallen behind. But amid ongoing trade tensions and reciprocal tariffs with the U.S.’s key trading partners, manufacturers are reevaluating their supply chains. For many, reshoring or nearshoring operations to the U.S. is becoming not just a financial hedge but also a strategic imperative.
We’ve heard from our public- and private-sector clients across North America more interest in becoming investment- (and tariff-) ready. Our firm is approaching this challenge with an eye for two key factors — infrastructure and tariff resilience. While these are certainly not the only factors, they are some of the biggest and most consequential.
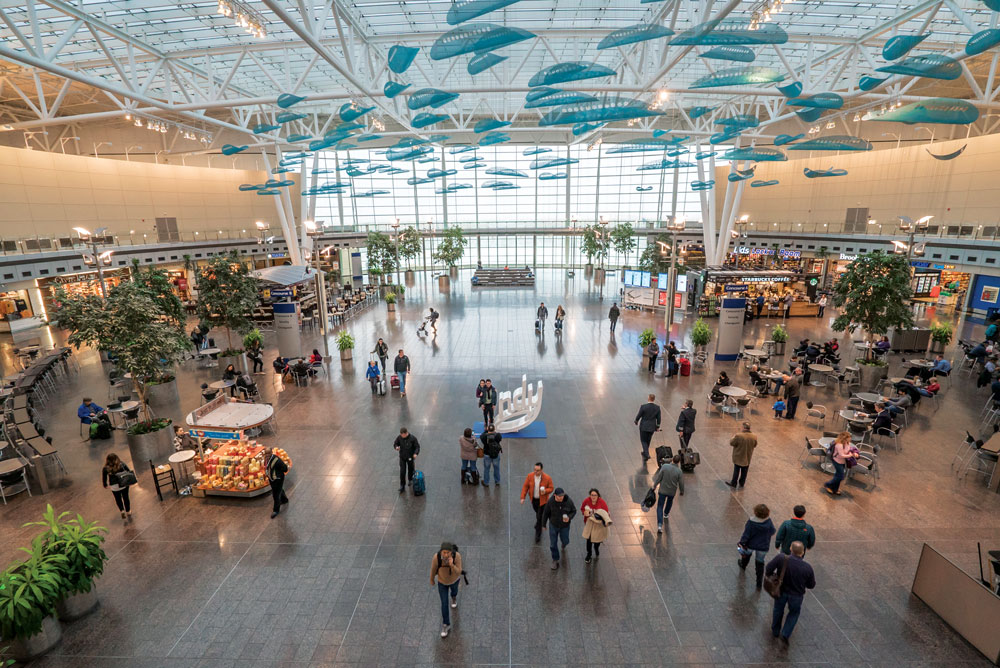
The Indianapolis International Airport (IND), a crucial element in the state’s infrastructure for business, set an all-time new record on Memorial Day 2025 with 23,473 passengers.
We conducted a thought experiment paired with some initial real-world data since tariffs took effect: To what extent will infrastructure readiness and tariff resilience shape site selection decisions? To that end, we’re exploring state-level infrastructure rankings and reconsidering the business case for foreign-trade zones (FTZs) as potential tariff safe havens. Finally, we examine emerging FDI data to see where manufacturing investments are actually being made.
Where Is Infrastructure the Most Investment-Ready?
Even as manufacturers consider reshoring, the supporting infrastructure isn’t always in place. Site decisions hinge on many factors like affordable power, workforce access, and shovel-ready land — but freight infrastructure is especially critical. The decision to reshore may be national, but investment decisions are deeply regional, local and site-specific.
The infrastructure report cards from the American Society of Civil Engineers (ASCE) offer one bird’s-eye view of the landscape. Overall, they rank U.S. infrastructure with a C, but rankings vary by infrastructure type. Ports lead with a B, but roads and aviation scrape by with D+ grades, and even rail — vital for freight — only earns a B-. These gaps could present hard limits for any manufacturing boom.
Infrastructure varies from state to state, however. From an overall perspective, a few states stand out in having the best (C+) overall infrastructure: Georgia, Wisconsin, and Utah. But ASCE also generates ranks for specific types of infrastructure that manufacturing site selectors will care about. From a rail-specific perspective, we see again at the top of the list Georgia, but now also Alabama; Mississippi; Connecticut; Washington, D.C.; and Ohio, with all these jurisdictions earning Bs.
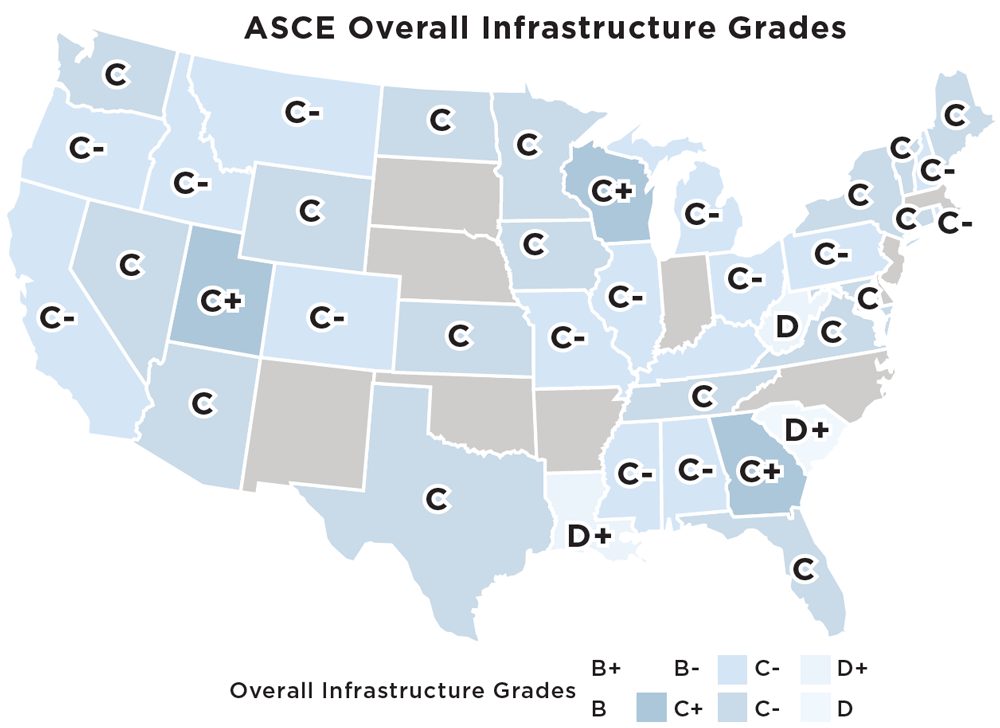
Data source: ASCE Infrastructure Report Card
Manufacturing also heavily relies on road networks to move inputs and outputs. From a road and trucking perspective, Utah again stands out with a B+, while Iowa and North Dakota earn Bs and Georgia and Vermont earn C+s.
Finally, let’s consider energy infrastructure, which is essential for manufacturing. Georgia and Alabama again stand out with Bs, followed by Nevada, Idaho, and Kentucky with B-s.
When considering energy, rail, roads, and overall rankings, we can see some potential investment regional hotspots in the South (Florida, Georgia, Alabama, Tennessee, Texas) and in the Midwest (Wisconsin, Iowa, Illinois, Ohio, Kentucky).
Tariff Resilience
Tariff scenario planning complicates decision-making a bit more. Even for companies reshoring production, their U.S. operations may only be one node in a global supply chain. This is particularly true for supply chains that have (up until now, at least) been seamlessly transnational between the U.S. and Canada. Take, for example, automotive manufacturing, where integrated supply chains cross the U.S.-Canada border repeatedly. In these contexts, tariff exposure isn’t just a one-time cost — it’s a compounding risk with every transaction.
Methodology for Top States and Top Metros: Cumulative and per-capita calculations based on Conway Projects Database projects, project-affiliated job creation and project-affiliated capital expenditure, Jan. 2021 through July 1, 2025. Cumulative and per-capita calculations based on project and funding data from the Bipartisan Infrastructure Law (BIL) Maps Dashboard. Retrieved from https://d2d.gsa.gov/report/bipartisan-infrastructure-law-bil-maps-dashboard
Many companies are still assessing whether tariffs are here to stay, but many are hoping to limit exposure to any future tariff risks. To that end, companies are giving new consideration to the U.S.’s 200 active Foreign-Trade Zones (FTZs), which can allow firms to defer, reduce or eliminate duties on imported materials assembled in the U.S. and re-exported or distributed domestically. It may come as no surprise that Congress created the Foreign-Trade Zones in 1934 as a means of mitigating the effects of the Smoot-Hawley Tariffs in 1930.
In today’s high-tariff or tariff-uncertain scenario, FTZs may play a larger role as a magnet for investments. FTZs can offer shelter warehouses for excess merchandise, and they host many manufacturing operations across sectors. Especially for firms whose supply chains seamlessly cross U.S. borders with Mexico and Canada, FTZ sites have the potential to generate huge gravity for U.S.-based investments. Integrated binational supply chains might not go away — they might just evolve.
Site Selection every November performs calculations to arrive at a ranking of top states by FTZ activity as well as top FTZs. In November 2024 that report highlighted the most active FTZ regions in California and the Gulf (Texas, Louisiana, and Florida). It’s also worth noting that FTZ designation does not necessarily mean activity, meaning that many designated FTZs may be underutilized and could have a more compelling business case.
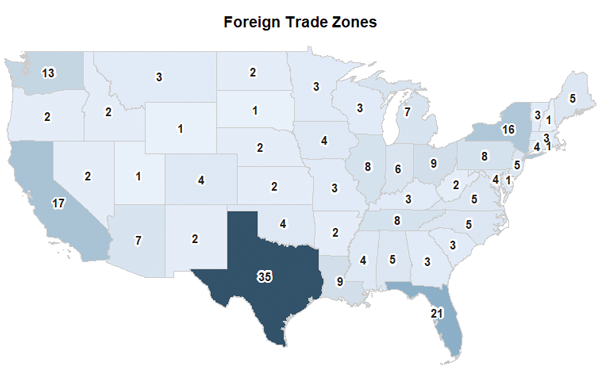
Map courtesy of EBP US
Methodology: Cumulative and per-capita calculations based on Conway Projects Database projects, Jan. 2021 through July 1, 2025, and cumulative and per-capita calculations based on OECD infrastructure funding data by country retrieved July 2025.
If we consider both infrastructure rankings and FTZs we get a more nuanced story about where we might expect investment. Texas and Florida stand out, by far, given their double-digit number of FTZs, but Arizona, Georgia, Wisconsin, Tennessee, Ohio, New York, and California also stand out as potential tariff safe havens.
Even before tariffs became an outsized consideration in the site selection industry, Site Selection’s 2024 Global Groundwork Index identified similar investment-ready hotspots (states and metros) by considering actual private-sector corporate project data with federal investment records, including Bipartisan Infrastructure Law (BIL) spending. The index last year and this year highlights the investment readiness of the Midwest (Ohio, Indiana, Kentucky, Michigan) and South (Georgia, Louisiana, Texas).
Do infrastructure rankings and FTZs match actual investment trends? At a glance, yes. Investment data for 2025 show hotspots in the U.S. South and Midwest, which infrastructure rankings and FTZ data would roughly suggest. These regions benefit from a combination of strategic assets: robust transportation networks, favorable logistics environments and concentrated Foreign-Trade Zones that reduce trade friction and costs. While the presence of FTZs appears to correlate with higher FDI volumes, infrastructure quality often acts as the underlying enabler, supporting both existing manufacturing bases and attracting new investment.
However, the relationship is not perfectly linear. Some states with moderate infrastructure grades have attracted significant FDI, likely due to other factors such as workforce availability and wages, state incentives or proximity to key markets. Conversely, high infrastructure ratings do not always guarantee investment if other conditions are unfavorable. This nuanced dynamic underscores the importance of integrating multiple data layers — FTZ counts, infrastructure rankings, workforce characteristics and economic incentives — to form a comprehensive picture of manufacturing investment patterns.
As manufacturers reconfigure their supply chains to hedge against tariffs and geopolitical (and other) risks, the decision to reshore is less about patriotism or incentives, and much more about pragmatism. The most attractive U.S. locations are (and have been) those that offer both strategic tariff mitigation (using FTZs and other tactics) and strong, resilient and well-connected infrastructure (power, telecoms, roads, rail, seaports, etc.).
That intersection — between infrastructure quality and resilience from tariffs — is highly uneven across the United States. Places like Texas, Indiana, Ohio, and parts of the Southeast continue to extend their advantages in trade and in foreign direct investment.
Even so, the broader picture is even more uneven. If the U.S. is to actually benefit from the aggressive use of tariffs, more regions will need to align infrastructure investment with long-term industrial strategy. That means going beyond ribbon-cuttings and focusing on integrated systems: power and water, rail and roads, ports and workforce pipelines.
The federal government has set a course, but that won’t guarantee a positive outcome. The question is whether we are ready to build — literally and strategically — for the next chapter of American manufacturing.
FTZs have been a tool that has been around for some time but not used effectively. In the face of tariffs and global supply chains, we now have an effective use case. Will we learn how to use them properly?
Look to the November 2025 issue of Site Selection for further analysis of special economic zones and free trade zones by the EPB team, as well a the publication’s annual ranking of top U.S. Foreign-Trade Zones and top Foreign-Trade Zone states.