Indices point to the globe’s best-performing maritime centers and ports.
by Adam Bruns, Chris Steele & Scott Brown
Every year in this space, Site Selection looks to rank U.S. Foreign-Trade Zones (FTZs) and the states whose FTZs carry (often literally) the most economic heft.
This year isn’t like every year.
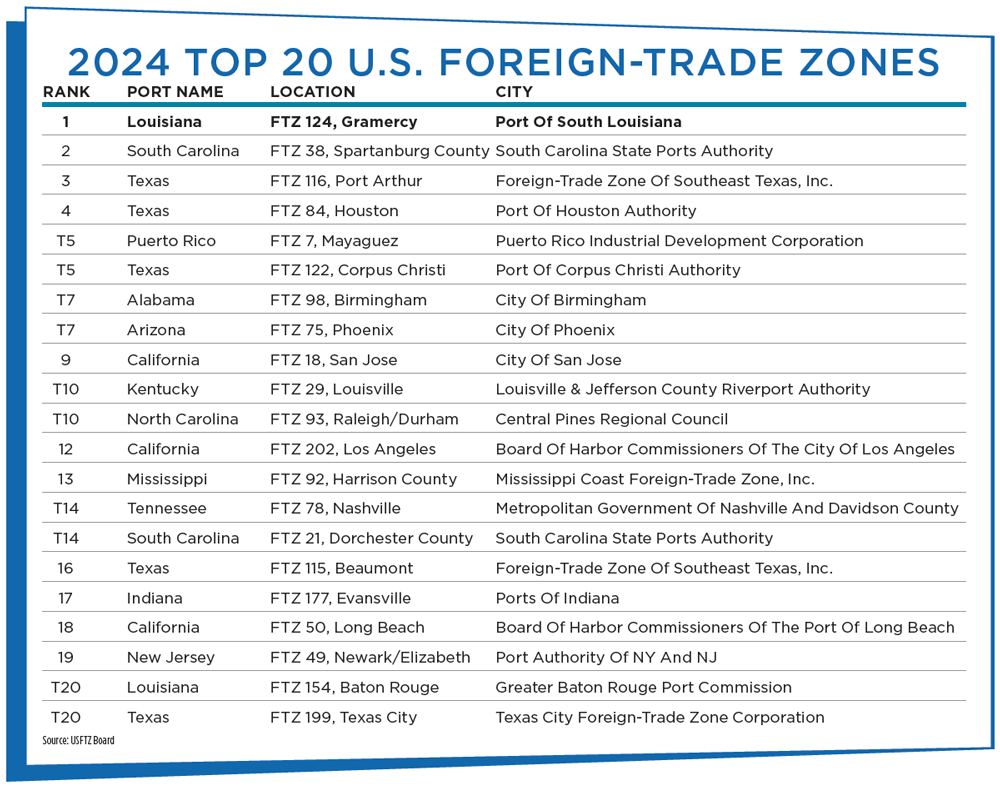
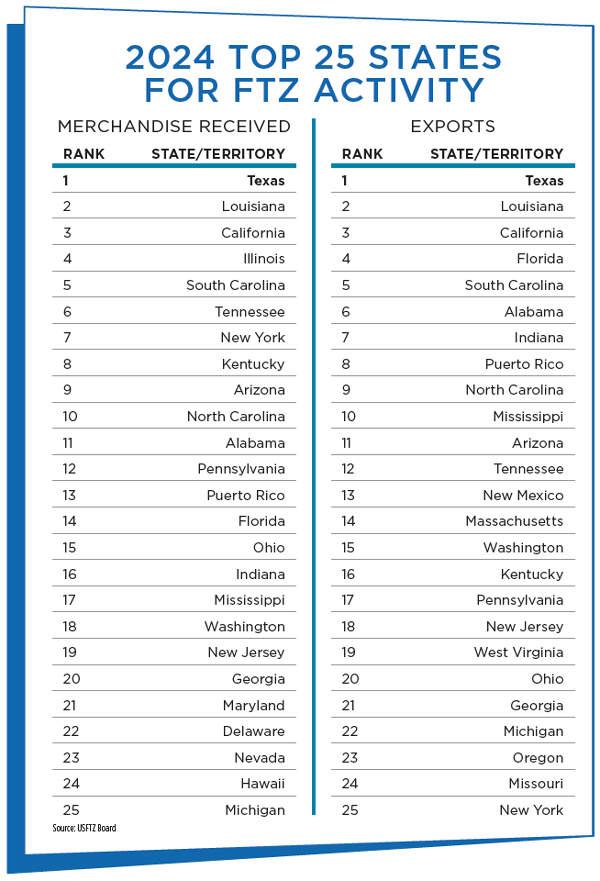
At the time of this writing, the U.S. federal government has yet to release its regularly scheduled annual FTZ data, for which there is little substitute. The annual report from the U.S. Foreign-Trade Zones Board to Congress, which contains updated data for all FTZs, was already running later than its usual August release, and the government shutdown assured that the new data wouldn’t be released in time for Site Selection’s annual rankings. This lack of visibility makes it difficult to impossible for public agencies and private investors alike to plan strategically. (For reference, we have included on p. 76 and p. 78 last year’s top FTZs and top states for FTZ activity.)
Historically, the United States’ strength has been the comparative transparency and reliability of its investment data, an asset that has underpinned global confidence in the American market. Ensuring that data on FTZ activity remains accessible and up to date is essential if we want these (and other) tools to fulfill their potential in strengthening the nation’s industrial base.
Meanwhile, day-to-day commerce carries on. For states and metropolitan areas, aligning FTZ strategies with infrastructure investments could magnify the impact of both. Coordinated planning among ports, logistics corridors and FTZ authorities could convert underutilized zones into active magnets for manufacturing. For manufacturers and investors, the message is clear: Tariff resilience and infrastructure strength are increasingly inseparable components of competitiveness.
Tariffs, Supply Chain and Government Data
The 25% Section 232 tariffs imposed in 2025 on imported automobiles and parts are already reshaping upstream supply chains. As the Plastics Industry Association notes, over one-third of automotive parts are made from plastics, and tariffs on vehicles have triggered ripple effects in materials processing. Automakers including GM, Stellantis, and Hyundai have responded with new or expanded U.S. investments, most notably in Illinois, Georgia, and Alabama, all states with active or adjacent FTZs. According to the annual report cards from the American Society of Civil Engineers, these states have emerged as having competitive logistical infrastructure. These cases illustrate how tariff exposure extends beyond final products, reinforcing the value of FTZs as buffers not only for manufacturers but also for their suppliers.
Not all industries are experiencing the same pressures and opportunities. In the energy sector, global dynamics are generating a different kind of FTZ advantage. As Europe accelerates its transition away from Russian energy and the US emerges as a leading oil and gas supplier, investors are advancing plans for a new route to transport liquefied natural gas (LNG) from Greece into Southeastern and Central Europe, including Ukraine.
This development could further expand European demand for U.S. LNG exports, positioning Gulf Coast terminals as critical nodes in global energy supply chains. FTZ designation can significantly reduce duties on imported materials for plant construction and operations while deferring tariffs on exports. Collectively, these benefits make FTZs a strategic instrument in reinforcing U.S. competitiveness in global energy trade.
Global Benchmarks and Competitive Context
The United States is not competing in isolation. International rankings and reports such as the Xinhua–Baltic International Shipping Centre Development Index (ISCDI), the Container Port Performance Index (CPPI) from World Bank Group and S&P Global Market Intelligence, and DHL’s Global Connectedness Tracker underscore how other trade hubs are integrating tariff strategy, digitalization and logistics efficiency. Singapore, for example, remains the world’s leading maritime center for the 12th consecutive year, scoring 99.5 out of 100 in the ISCDI on measures that include port infrastructure, professional support services and customs tariff regimes.
The U.S. ranks high on infrastructure capacity but lower on the efficiency of trade facilitation and customs processes. Meanwhile, DHL’s 2025 data show that even amid tariff escalation, global trade volumes continue to grow and supply chains are stretching across longer distances rather than collapsing inward. Together, these benchmarks suggest that if the U.S. wants FTZs to play a truly strategic role, they must be viewed not only as domestic policy tools but as components of an increasingly competitive international logistics ecosystem.
The global indices make clear that competitiveness today is defined less by capacity than by coordination. Singapore, Rotterdam and Dubai consistently outperform because they integrate port efficiency, customs policy, digital trade systems and industrial strategy into a single, cohesive framework. By contrast, the United States (despite its vast scale and investment capacity) still manages these components largely in silos. Freight corridors, FTZ designations and infrastructure grants each follow separate funding and governance paths.
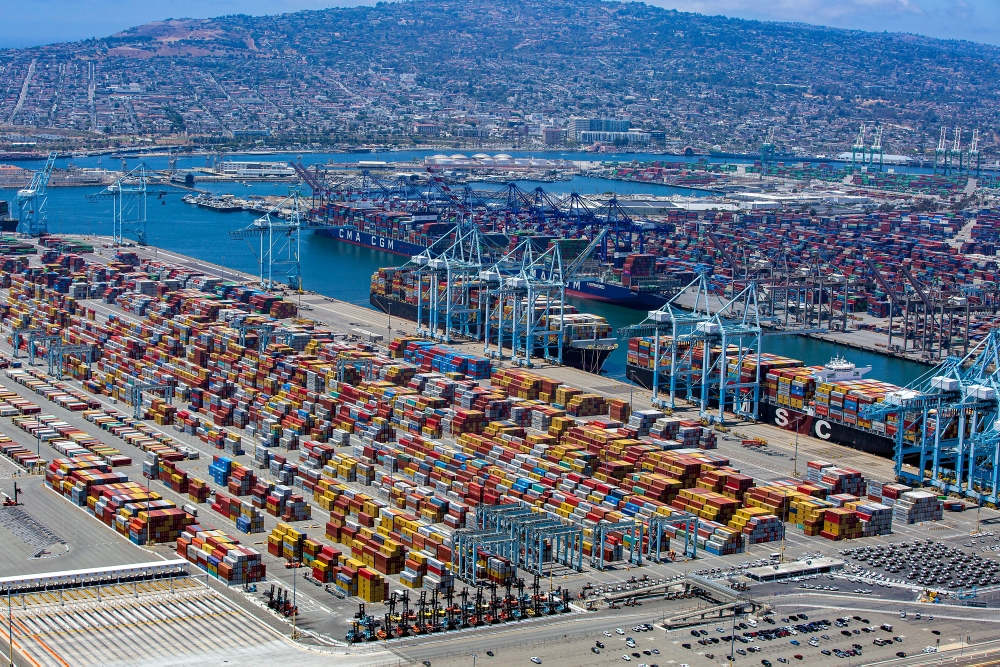
The result is that even as ports such as Houston, Savannah and Los Angeles operate at world-class volumes, they are not always connected to equally strategic industrial ecosystems inland. For the U.S. to compete with the world’s leading maritime centers, it must think less about isolated facilities and more about integrated systems: ports that feed industrial corridors, FTZs that anchor manufacturing clusters, and logistics investments that serve both. The physical and policy architecture of trade must evolve together.
Here are some insights from all three international analyses:
Baltic Exchange, in collaboration with Xinhua News Agency, in July released the 2025 Xinhua-Baltic International Shipping Centre Development Index (ISCDI) Report. This annual report, now in its 12th year, evaluates a total of 43 maritime locations, considering various port metrics such as cargo throughput, crane count, container berth length, and port draught. It also assesses the presence of professional maritime support businesses, alongside hull underwriting premiums. Additionally, the evaluation considers general business environment factors like customs tariffs, the level of electronic government services, and overall logistics performance.
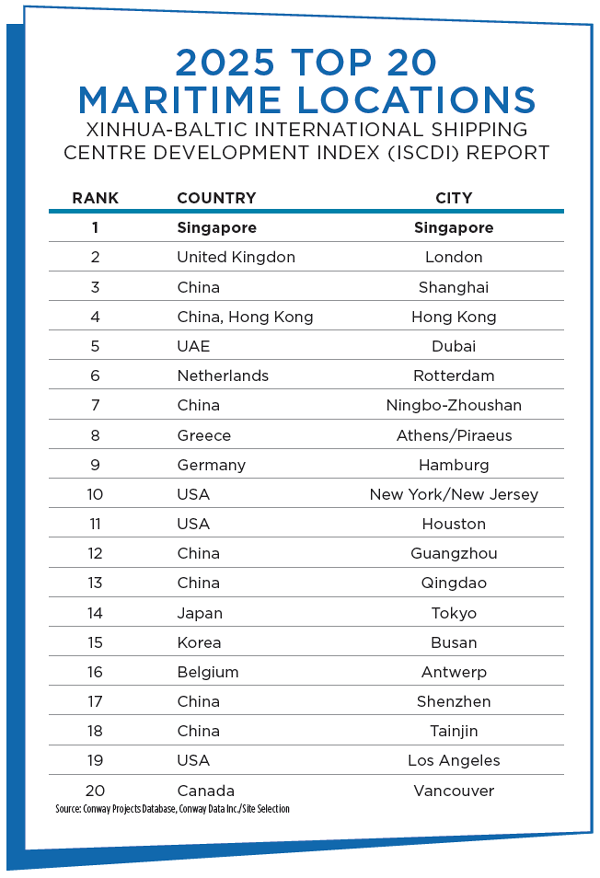
Singapore’s enduring success is attributed to its strategic location, robust international outlook, and a well-established ecosystem of professional maritime services, the ISCDI found. “London once again secured second position with a score of 81.02, demonstrating its continued prominence as a maritime support services powerhouse. Shanghai, with a score of 81.01, retained third place, highlighting its significant role as a major port city in Asia. London and Shanghai have maintained their positions within the Index for the past five years.” See the chart on p. 74 for the full top 20.
Among key findings of the 216-page ISCDI Report:
- China’s shipping centers are on the rise: Guangzhou, Qingdao and Tianjin all have improved their rankings, while Ningbo-Zhoushan climbed to seventh — marking its third consecutive year of upward movement.
- Los Angeles and Vancouver were new to this year’s list, taking 19th and 20th position, marking two new North American ports in the global rankings.
- “The shipping industry is undergoing a transformative shift,” added Cao Zhanzhong, head of Xinhua Index Research Institute of China Economic Information Service. “Although facing many challenges, the dry bulk market hit a new record, fueled by iron ore and coal demand. Container shipping normalized post-pandemic, while the tanker and LNG sectors faced headwinds from oversupply and shifting trade patterns.”
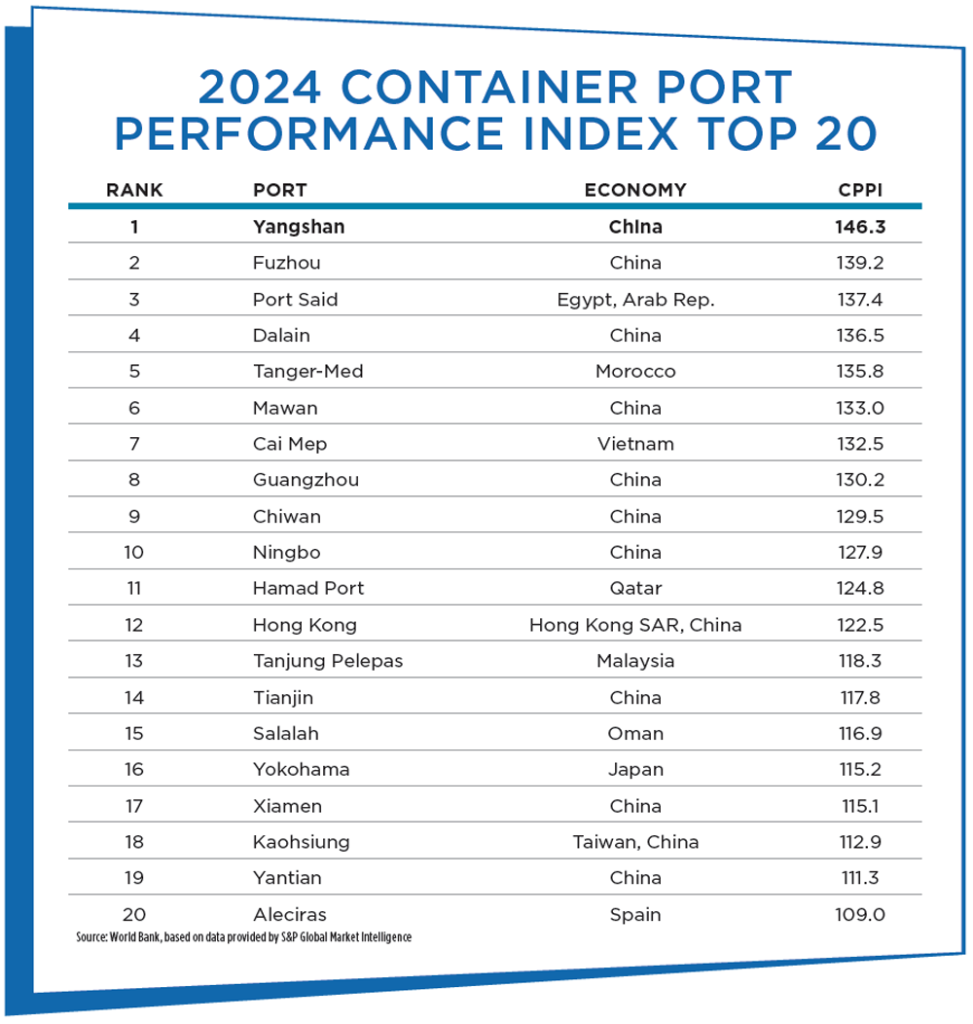
For the first time, this year’s Container Port Performance Index, which assigns scores to over 400 ports, analyzes trends over time since the report was first launched in 2020. After scores had rebounded in 2023 from the global pandemic, “the resurgence of stress in global maritime supply chains, stemming from the Red Sea crisis and ongoing climate-related disruptions at the Panama Canal, triggered new operational inefficiencies,” this year’s CPPI reported. “Rerouted shipping via the Cape of Good Hope and reduced transits through the Panama Canal led to schedule unreliability and increased port congestion. CPPI scores declined modestly, though less dramatically than during the COVID-19 era. The disruptions in 2024 were primarily geopolitical and climatic rather than demand-driven, underscoring the evolving nature of global supply chain vulnerabilities.”
In addition to the top 20 ports listed in the chart here, the CPPI examined which ports have improved their score the most since 2020. The greatest improvement over four years was by the Port of Posorja in Ecuador, followed by Gothenburg, Sweden; Marseille, France; Philadelphia, Pennsylvania and Mawan, China. Port Said in Egypt is the seventh most improved port and now ranks No. 3 overall globally. “Egypt’s overall trade logistics have also improved, with the country ranked 57th of 139 in the World Bank’s 2023 Logistics Performance Index, highlighting broader progress in port operations and hinterland connectivity that benefited Port Said,” the report states.
Between 2023 and 2024, the top improvers were ports in Cape Town, South Africa; Cotonou, Benin; and Mersin, Turkey, where the big turnaround reflected recovery from a 2023 earthquake in addition to capacity expansion at “East Med Hub 2” by PSA International. As that rebound suggests, some things are beyond a port authority’s control. But others, such as physical improvements, are not.
“On the physical side, targeted investments can yield outsized benefits,” the report suggests. “Adding even one or two modern cranes, or a fleet of new terminal trucks, can substantially improve throughput.In addition to implementing basic terminal management software or utilizing mobile apps for coordinating truck drivers, other steps can include training staff in efficient planning and maintenance; making process improvements such as stricter enforcement of maintenance schedules and periodic rearranging of the yard to prevent bottlenecks when big ships arrive; and setting clear performance targets such as reducing average berth hours by a certain percentage.
“There is growing recognition,” the report finds, “that port efficiency is not a luxury but a development necessity. Improving port efficiency is crucial for unlocking a region’s growth potential, as ports serve as vital gateways that significantly influence economic outcomes. With that perspective, even low-income country terminals are increasingly seeking to adopt best practices incrementally. Each hour saved at berth not only boosts their CPPI index values but also signals to shipping lines and investors that the port is becoming a more reliable node in global trade.”
An October update to the DHL Global Connectedness Tracker found that even as protectionist measures and tariffs make noise, the quiet hum of trade and commerce rolls on. The Tracker’s composite forecast projects a 2.5% annualized growth rate in global trade volumes from 2025 to 2029, roughly matching the pace of the previous decade. “One reason why trade can continue growing even as the U.S. raises tariffs is that only 13% of global goods imports went to the U.S. in 2024 and 9% of exports came from the U.S.,” said the report from the DHL Initiative on Globalization at NYU Stern’s Center for the Future of Management. “Another is that most countries have not followed the U.S. in implementing broad tariff increases.”
“Data on international corporate investment during the first half of 2025 were mixed, but they underscore the general resilience of global business,” the report stated. “There was no pattern of companies redirecting investment from foreign to domestic markets. The cross-border share of M&A deals, for example, remained largely unchanged. However, uncertainty did appear to deter some cross-border investment, especially smaller transactions and new investments during the second quarter of 2025.
“Trade and international business investment trends so far in 2025 do not support the view that globalization has gone into reverse,” the report concluded. “While it would be a mistake to disregard current policy threats to globalization, companies are not generally pulling back from international markets, trade is crossing the longest average distance on record, and geopolitical conflicts have reshaped only a small fraction of the world’s international activity. The latest data show companies managing the risks and opportunities of a connected world rather than retreating to within countries or regions.”
If tariffs and trade realignment are here to stay, the U.S. will need to build not just more infrastructure, but smarter infrastructure. That means treating FTZs, ports, industrial parks and workforce systems as interdependent assets rather than stand-alone initiatives. Just as the Bipartisan Infrastructure Law jump-started long-overdue modernization, a next-generation trade infrastructure strategy could focus on aligning logistics efficiency with industrial policy. This includes digitizing port operations, expanding inland intermodal connectivity and streamlining FTZ activation for manufacturers facing tariff exposure.
States such as Texas, Georgia and Ohio already demonstrate what coordinated investment can look like: where ports, rail, energy and workforce programs reinforce one another. Scaling that coordination nationally could transform the U.S. from a tariff-reactive economy to one that is strategically trade-resilient.
And then — with a truly integrated and fully-functioning system — it’ll be a simple matter of finding a port or Free Trade Zone to plug into a fully connected world.