 Contact: Contact:Adam Bruns, Editor in Chief (770) 325-3491 adam.bruns@siteselection.com 6625 The Corners Parkway, Suite 200 Press Release  Texas, South Dakota Repeat as Site Selection Magazine Governor’s Cup Champions Top Metro and Micropolitan Areas for Corporate Facility Investment, Top Mississippi River Regions Also Named Atlanta, March 3, 2025: Texas and South Dakota have won the 2024 Site Selection Governor’s Cups. This is the 11th year Site Selection recognizes the state with the most qualifying new and expanded facilities per capita, which South Dakota claims for the second time in a row for its corporate end-user project activity in 2024. Texas wins for the 13th straight time for having the most qualified projects of any state. Mark Arend, editor emeritus of Site Selection, wrote the issue’s cover story containing his conversations with Texas Governor Greg Abbott, former South Dakota Governor Kristi Noem (now U.S. Secretary of Homeland Security) and current South Dakota Governor Larry Rhoden. “Independently, both Gov. Abbott and Secretary Noem used ‘freedom’ as a watchword,” says Adam Bruns, editor in chief of Site Selection. “Talent, infrastructure, robust business ecosystems and supportive policies have something to do with it too.” The 71-year-old Atlanta-based magazine has awarded the Governor’s Cup annually since 1988, based on new and expanded corporate facilities as tracked by the proprietary Conway Projects Database. Site Selection, published by Conway Data, is the senior publication in the corporate real estate and economic development fields. The magazine’s yearly analyses are regarded by corporate real estate analysts as “the industry scoreboard” and are closely watched by more than 41,000 qualified subscribers, most of whom are involved in corporate facility location decisions at the CEO/President/COO level. The Lone Star State’s total of 1,368 qualifying projects was up by 114 projects (9%) over the state’s 2023 total of 1,254 and outdistanced No. 2 Illinois by 704 projects, though the Land of Lincoln saw an increase of 112 projects to reach 664. No. 3 Ohio sits just behind Illinois with 565 projects (103 more than the previous year), followed by No. 4 California with 323 projects, a dip from 375 in 2023. Georgia repeats as No. 5 with 262 projects, down by 56 projects. The biggest upward mover in the Top 10 was No. 6 North Carolina, which moved up from No. 10 last year and reported 261 projects — 45 more than in 2023. In the per capita (projects per 1 million residents) contest, South Dakota earned its spot with 55 projects, up from 40 the previous year and approximately 25 times smaller than the Texas total, spread across a population 33 times smaller than that of Texas. Illinois repeats as No. 2, while No. 3 Ohio switches spots from last year with No. 5 Kentucky and Texas repeats as No. 4. The biggest upward movers in the per-capita Top 10 were Alabama (from No. 11 to No. 7) and a surging Massachusetts, which went from unranked No. 17 last year to No. 8 this year with 207 projects, a 47% increase from 141 qualified projects the previous year. “The Governor’s Cups recognize not only the winning governors, but their entire economic development teams, and by extension, the many professionals throughout their states who work every day to attract new investment and retain and grow existing businesses,” says Mark Arend. “Governors Abbott and Rhoden, former Governor Noem and their teams deliver the kind of business climate and fiscal predictability that capital investors from around the world rely on for long-term success.” Populated all year long by the Conway Data research team led by Daniel Boyer and Karen Medernach, Site Selection’s Conway Projects Database focuses on new corporate end-user facility projects with significant impact, including headquarters, manufacturing plants, R&D operations, data centers and logistics sites, among others. It does not track retail and government projects, nor schools, hospitals or infrastructure investments. New facilities and expansions included in the analyses must meet at least one of three criteria: (a) a capital investment of at least US$1 million, (b) at least 20 new jobs or (c) at least 20,000 sq. ft. of new floor area. Top Metros and MicrosIn this year’s Top Metros rankings, Chicago-Naperville-Elgin, Illinois-Indiana-Wisconsin, was No. 1 for the 12th straight year among metro areas with populations over 1 million with 582 projects (97 more than in 2023), while the Dallas-Fort Worth-Arlington region (489 projects, up by 37) and Houston-The Woodlands-Sugar Land region (435, up by 22) finished second and third in the total projects rankings. At No. 6 (after New York and Boston) comes metro Austin, up from No. 10 last year, making it three of the top six in Texas. Showing the most dramatic upward move in the Tier 1 Top Metros Per Capita rankings, the Austin region leaps from No. 7 to No. 1, followed by Chicagoland, DFW, Greater Houston and Cincinnati, which moves up to No. 5 from No. 8 last year. With 44 projects, Dayton-Kettering, Ohio is the No. 1 Top Metro in Tier 2, for populations between 200,000 and 1 million. New Orleans-Metairie comes in at No. 2, followed by last year’s champion region of Allentown-Bethlehem-Easton (Lehigh Valley) at No. 3. The Tier 2 Per Capita rankings are again topped by repeat No. 1 Sioux Falls, South Dakota (22 projects, vs. 23 in 2023), followed by upstart but well-known Auburn-Opelika, Alabama, at No. 2 after being unranked last year. Savannah, Georgia, is No. 3, followed by Greater Dayton at No. 4 and Lexington-Fayette, Kentucky, at No. 5. Among Tier 3 areas with populations between 50,000 and 200,000, Bowling Green, Kentucky (24 projects after 23 the previous year), repeats as No. 1 in front of Sioux City, Iowa-Nebraska-South Dakota (Siouxland, with 12 projects). Burlington, North Carolina jumps from a tie for No. 8 last year to No. 3 this year, followed by Lima, Ohio and Sherman-Denison, Texas, in a tie at No. 4. Bowling Green also tops the Tier 3 Top Metros Per Capita, followed by Lima; No. 3 Columbus, Indiana; No. 4 Siouxland; and No. 5 Paducah, Kentucky-Illinois. Eight of the Top 10 and ties in the Tier 3 Top Metros by Projects and seven of the Top 10 Tier 3 Top Metros by Projects Per Capita did not make their respective Top 10s last year. In the magazine’s ranking of Top Micropolitans — cities of 10,000 to 50,000 people which cover at least one county — Findlay, Ohio, once again was tops among the nation’s 543 micropolitan areas, tallying 24 projects last year after scoring 25 the previous year. Second place went to Greenville, Ohio, with 16 projects, followed by New Philadelphia-Dover, Ohio, and Wooster, Ohio, in a tie for No. 3. Indeed, as documented by Site Selection Senior Editor Gary Daughters, Ohio accounts for five of the top six and 20 Top Micros (representing 135 total projects) among the Top 100 and ties recognized by Site Selection. Georgia had 13 Top Micros for second place, while Illinois took third place with 11. The highest-ranking non-Ohio Top Micros are Cullman, Alabama, at No. 5 with 12 projects, followed by Auburn, Indiana; Tupelo, Mississippi; and Danville, Virginia, in a tie for No. 8. Mississippi River CorridorIn this same issue, St. Louis, Missouri-Illinois (for the third year in a row), and Fort Madison, Iowa, are recognized as the overall and per-capita No. 1 metro areas along the entire length of the Mississippi River Corridor, based on private-sector facility projects tracked over an 18-month period tracing back to July 2023. Greater St. Louis tallied 126 (up by 18 projects from the prior 18-month period), edging out the 109 projects in Minneapolis-St. Paul-Bloomington, Minnesota-Wisconsin. In the per capita category, Fort Madison, a town of just over 32,000 people in Iowa’s southeastern corner not far north of St. Louis, tops the charts with three projects, followed by Paducah at No. 2 and last year’s per-capita champ Blytheville, Arkansas, at No. 3. Complete charts of the March 2025 issue’s primary national rankings and regional rankings can be found below. Full charts and data can be found in the rankings stories posted at the magazine’s award-winning website, www.siteselection.com. Site Selection magazine, published by Conway Data Inc., delivers expansion planning information to a qualified circulation of 41,000 executives of fast-growing firms. Now in its 72nd year, Site Selection is also available via Site Selection Online. Headquartered in metro Atlanta (Peachtree Corners, Gwinnett County), Conway Data, publisher of Site Selection magazine and industry newsletters, in 2017 was recognized as Georgia International Small Business of the Year by the Atlanta Business Chronicle. Conway Data has been a trusted advisor to corporations, government economic development and investment promotion agencies around the world since 1954. Conway Data also manages the Industrial Asset Management Council. (Note: All circulation information is publisher’s own data unless otherwise specified). 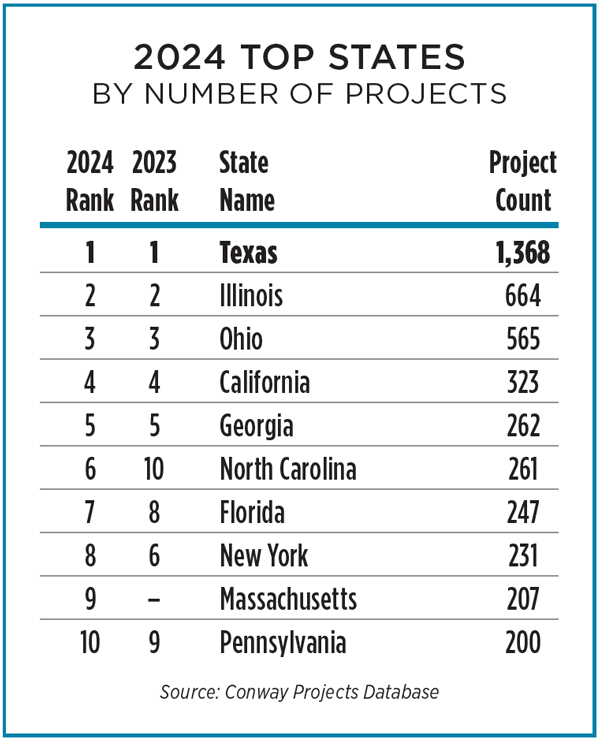 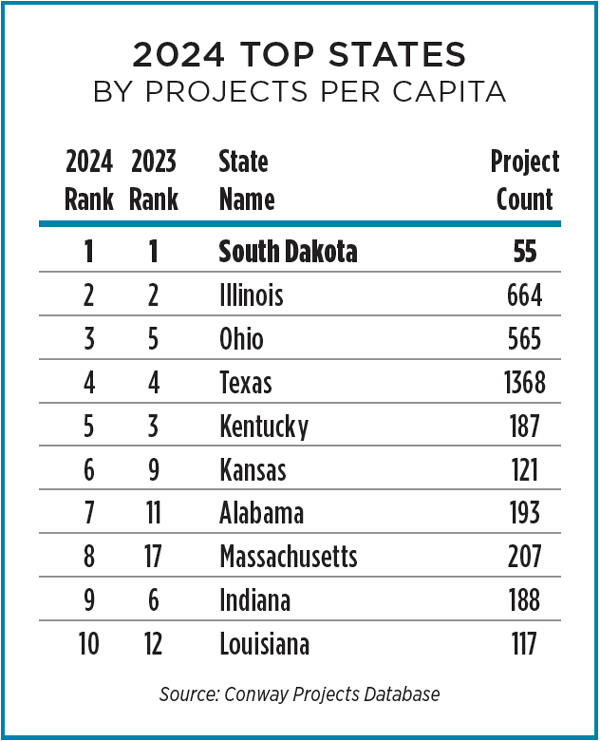 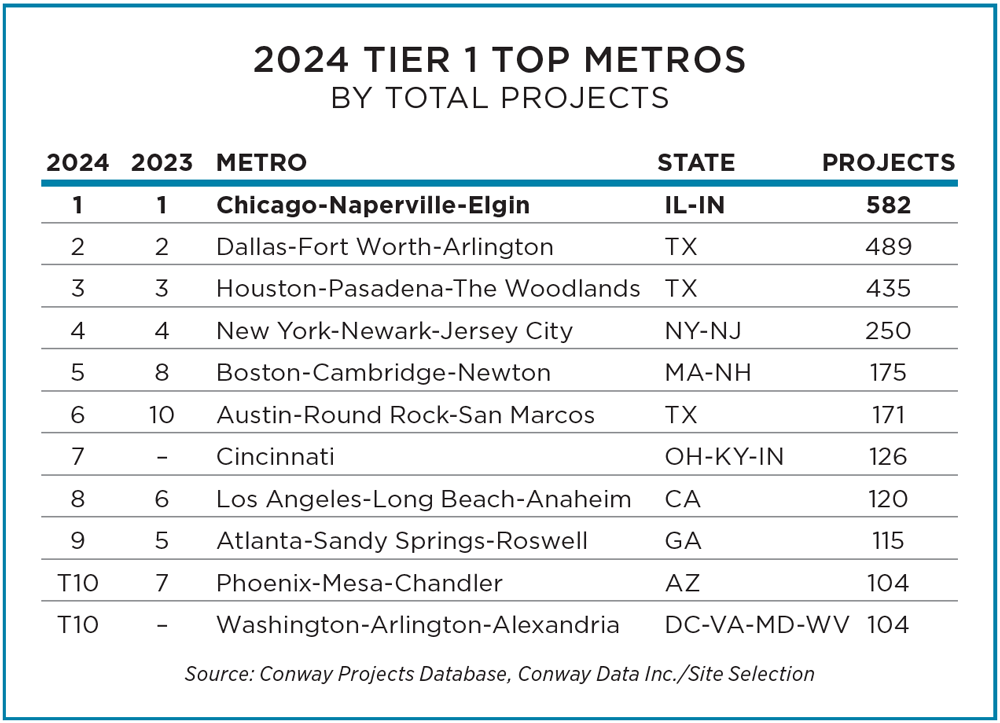 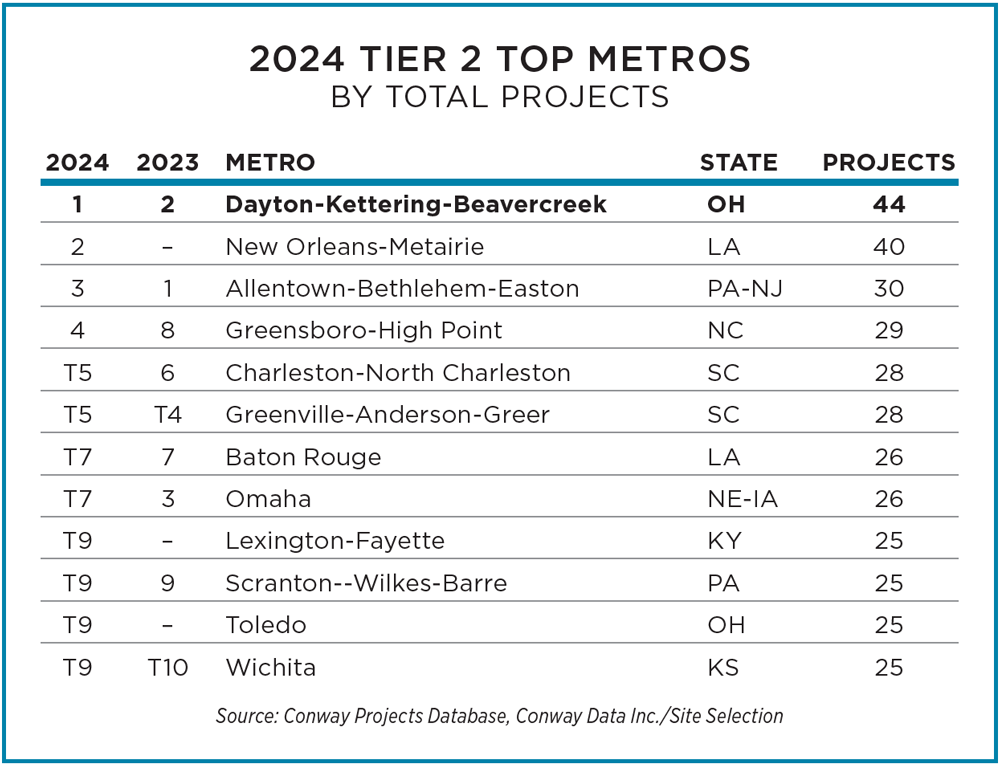 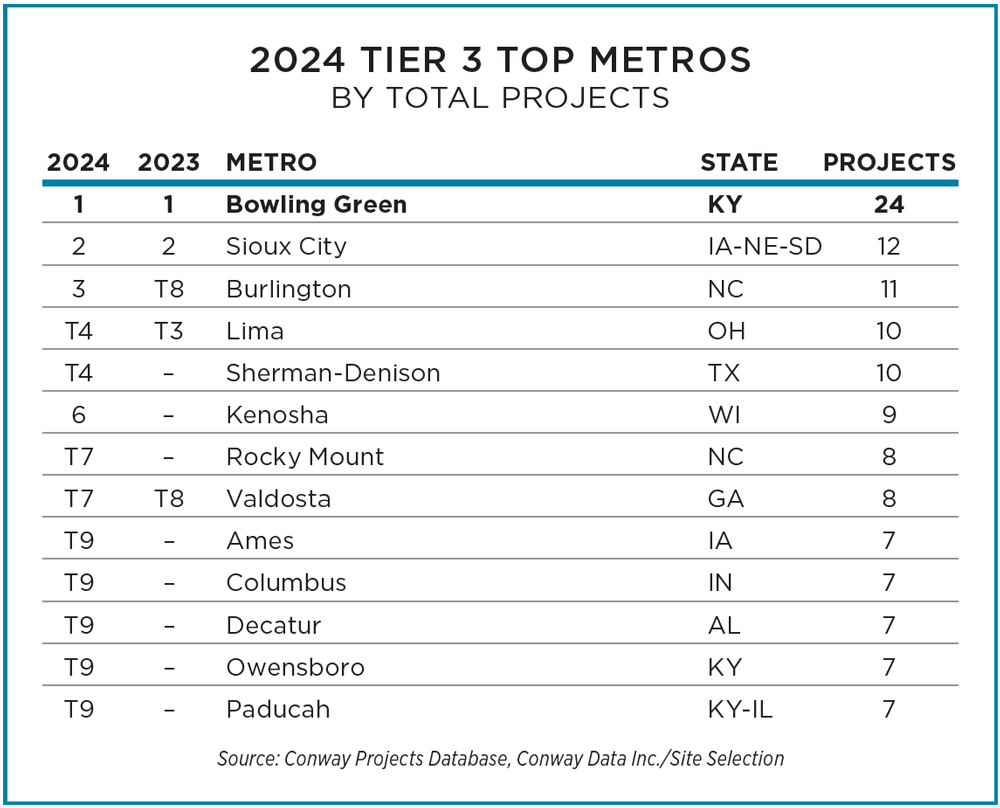 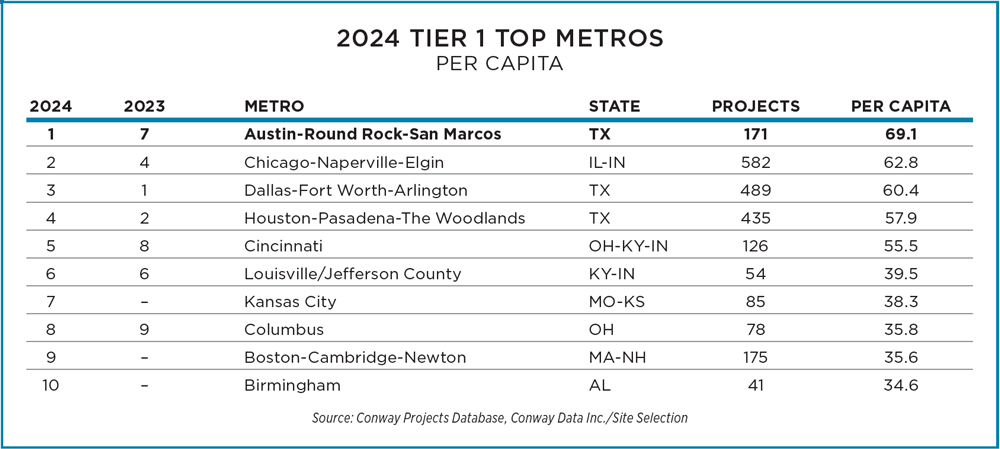 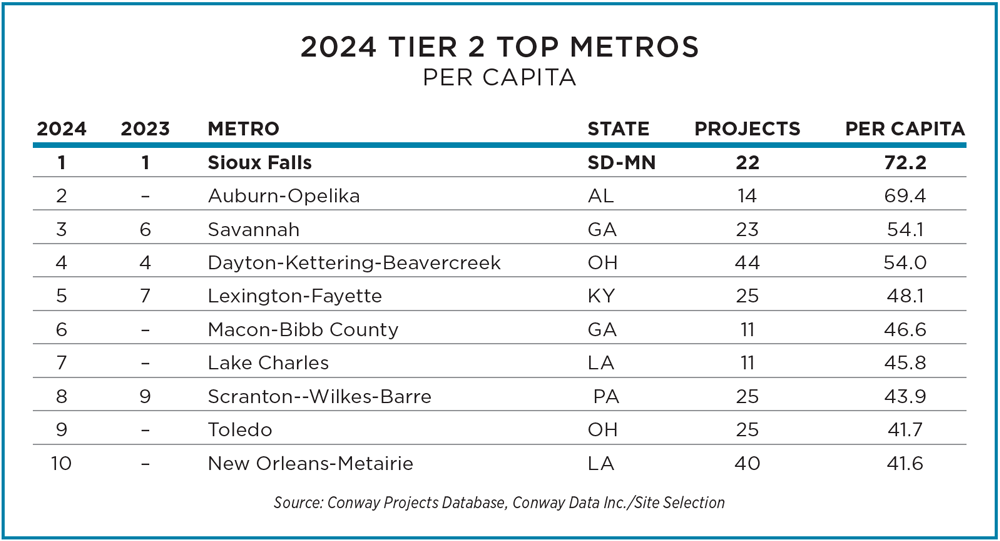 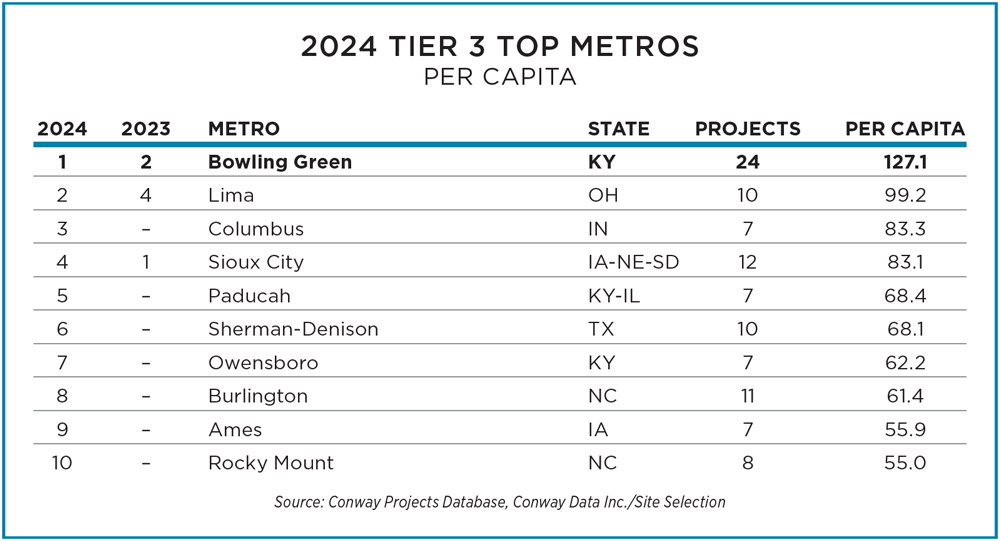 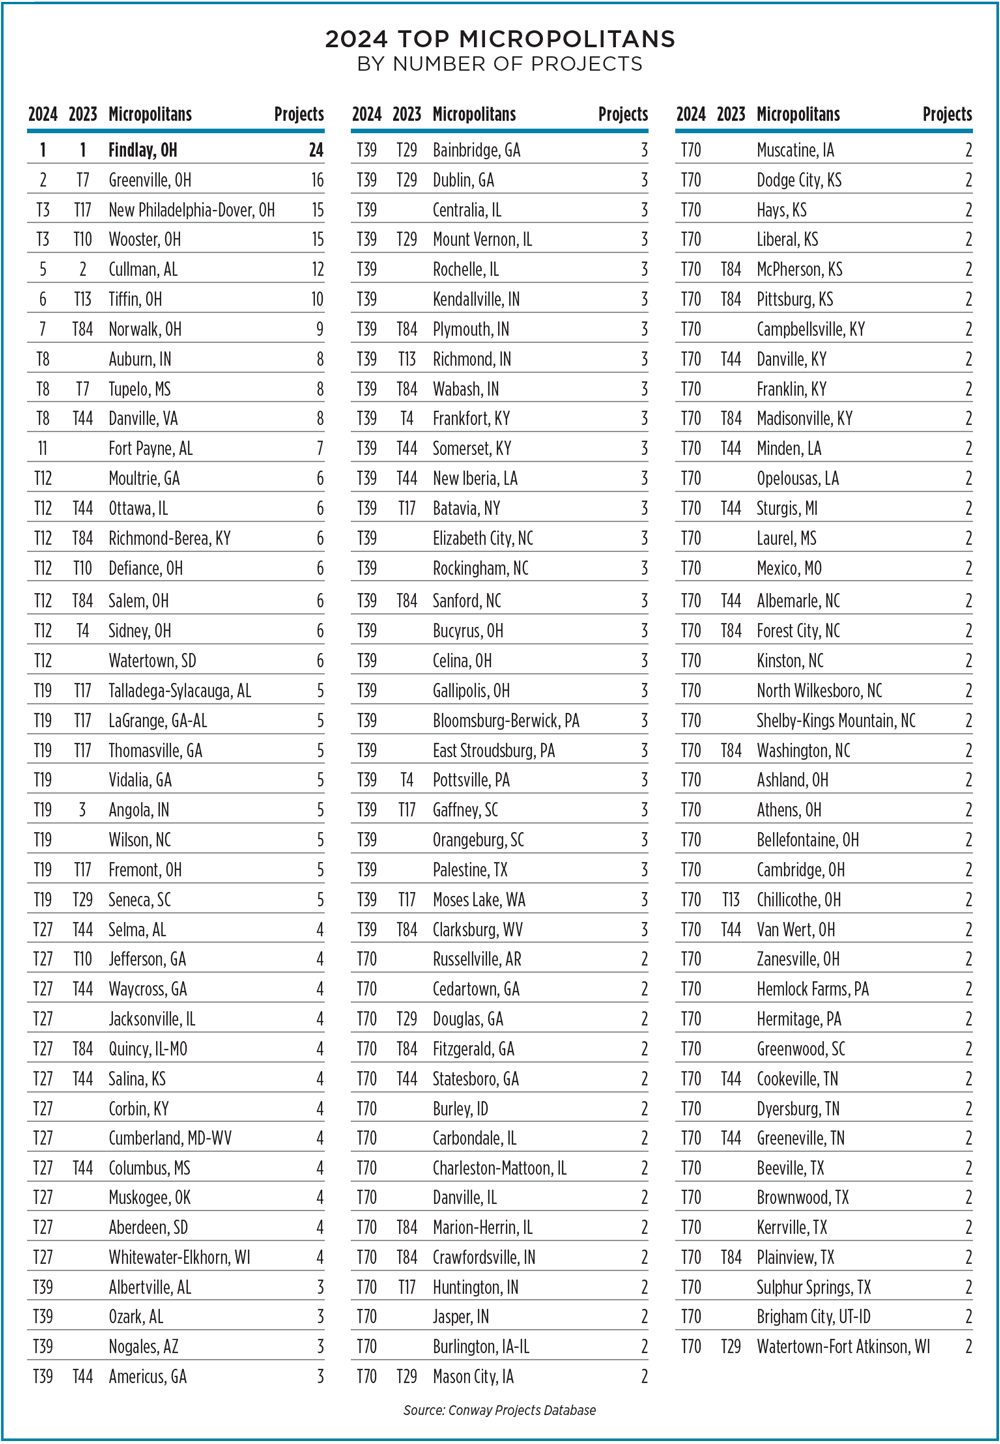 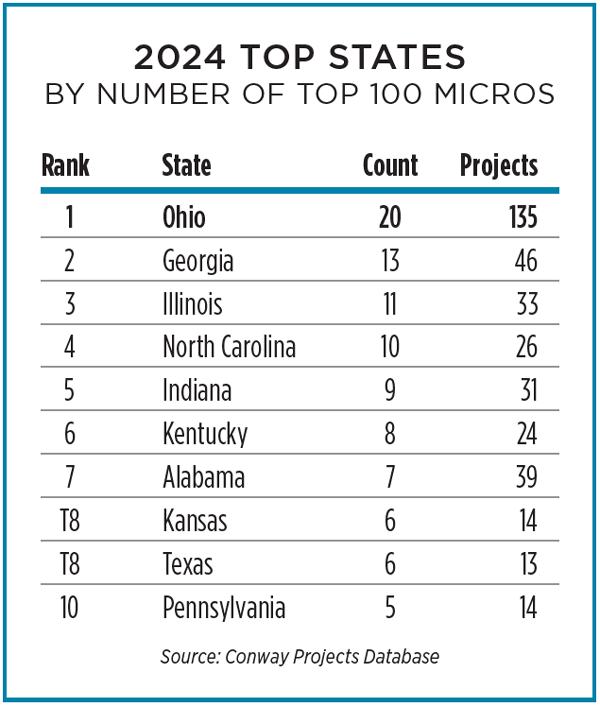 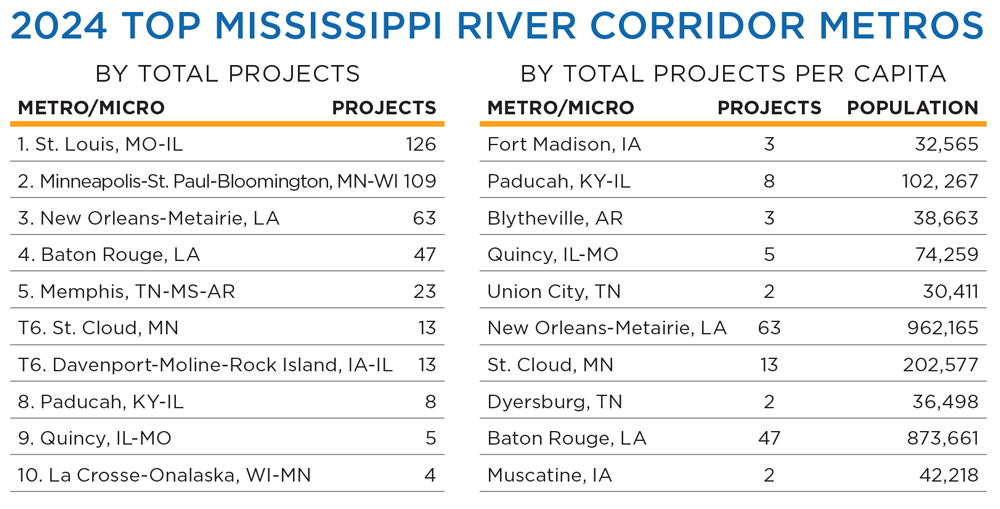 |
Press Release