 Contact: Contact:Adam Bruns, Editor in Chief (770) 325-3491 adam.bruns@siteselection.com6625 The Corners Parkway, Suite 200 Peachtree Corners, GA 30092 • USA www.siteselection.com Press Release  Texas and North Dakota Named Site Selection Magazine Governor’s Cup Champions Top Metro and Micropolitan Areas for Corporate Facility Investment, Top Mississippi River Regions Also Named Atlanta, March 2, 2026: Texas and North Dakota have won the 2025 Site Selection Governor’s Cups. This is the 12th year Site Selection recognizes the state with the most qualifying new and expanded facilities per capita, which North Dakota claims for the first time in history for its corporate end-user project activity in 2025. Texas wins for the 14th straight time for having the most qualified projects of any state. Site Selection Editor in Chief Adam Bruns wrote the issue’s cover story containing his conversations with Texas Governor Greg Abbott and North Dakota Governor Kelly Armstrong. Also featured in the cover story is Site Selection Executive Vice President Ron Starner’s interview with Illinois Governor JB Pritzker, whose state was runner-up in both the cumulative and per-capita categories. The 72-year-old Atlanta-based magazine has awarded the Governor’s Cup annually since 1988, based on new and expanded corporate facilities as tracked by the proprietary Conway Projects Database. Site Selection, published by Conway Data, is the senior publication in the corporate real estate and economic development fields. The magazine’s yearly analyses are regarded by corporate real estate analysts as “the industry scoreboard” and are closely watched by nearly 42,000 qualified subscribers, most of whom are involved in corporate facility location decisions at the CEO/President/COO level. The Lone Star State’s total of 1,406 qualifying projects was up by 2.7% over last year’s Texas tally of 1,368 projects. The state’s 2025 total was more than double that of No. 2 Illinois (680) and more than triple No. 3 Ohio’s total of 467 projects. “We are proud to have won the Governor’s Cup for 14 years in a row,” Gov. Abbott tells Site Selection, noting that economic development is a team sport. “I thank the dedicated economic developers across the state who work each and every day to increase economic prosperity across Texas. Without their efforts, this award would not be possible. Texas sets the standard. When you’re in the lead, everyone is watching — and there are many states looking at Texas.” California repeats at No. 4 with 367 projects (up from 323 the year before), followed by Florida, which jumped from No. 7 to No. 5 this year with 326 projects, barely outgunning No. 6 Georgia and its 319 projects. The biggest upward mover among the top 10 was Virginia, moving up from No. 14 last year to No. 10 this year with 189 projects. In the per capita (projects per 1 million residents) contest, North Dakota came from out of nowhere to take the top spot with 145 projects in a state with a population just cresting 800,000 residents. But Gov. Kelly Armstrong doesn’t think so. “I don’t think we really did come out of nowhere,” he says, noting the state’s methodical approach to building out infrastructure. “We want a holistic approach to economic development. I think the groundwork for this was set over the last two or three legislative sessions and under Governor [now U.S. Secretary of the Interior] Doug Burgum’s leadership. Then we get to come in and really operationalize things that were put in play a long time ago.” Kansas jumps from No. 6 in projects per capita last year to No. 3 this year with 137 projects. Texas takes fourth and Kentucky takes fifth, repeating their performances last year. This year two new territories to make the list include the District of Columbia at No. 9 and Georgia at No. 10. Populated all year by the Conway Data research team led by Daniel Boyer and Karen Medernach, Site Selection’s Conway Projects Database focuses on new corporate end-user facility projects with significant impact, including headquarters, manufacturing plants, R&D operations, data centers and logistics sites, among others. It does not track retail and government projects, nor schools, hospitals or infrastructure investments. New facilities and expansions included in the analyses must meet at least one of three criteria: (a) a capital investment of at least US$1 million, (b) at least 20 new jobs or (c) at least 20,000 sq. ft. of new floor area. Top Metros and MicrosIn this year’s Top Metros rankings, Chicago-Naperville-Elgin, Illinois-Indiana-Wisconsin, was No. 1 for the 13th straight year among metro areas with populations over 1 million with 606 projects (24 more than the 582 tallied the year before). Greater Houston takes No. 2 with 590 projects and Dallas-Fort Worth comes in at No. 3 with 410 projects. New York repeats its No. 4 performance with 268 projects and the Atlanta metro area makes the biggest upward leap among the top 10, jumping from No. 9 to No. 5 with 159 projects. With 147 projects, Greater Austin at No. 6 completes the trio of Texas regions comprising half of the top six positions, barely outdistancing the Boston metro area (146). Next comes new top 10 arrival metro Miami at No. 8 (131 projects), followed by No. 9 Cincinnati and No. 10 Los Angeles. Houston is No. 1 in this year’s Top Metros by Projects Per Capita rankings, followed by Chicago and Austin. In Tier 2 (population between 200,000 and 1 million), Allentown-Bethlehem-Easton (Lehigh Valley) takes the top spot, fueled by 49 projects across a variety of industries from logistics to life sciences. The biggest upward mover is Des Moines-West Des Moines, Iowa, coming all the way from outside the top 10 last year to No. 2 this year with 37 projects. Wichita, Kansas, also takes a giant step, climbing from a tie for No. 9 last year to No. 3 this year with 34 projects. The other community tied for No. 9 last year, Lexington-Fayette, Kentucky, moves up to a tie for fourth place with Dayton-Kettering-Beavercreek, Ohio, with 27 projects each. The Tier 2 metros topping the projects per capita chart are Fargo, North Dakota-Minnesota; Auburn-Opelika, Alabama (which just entered the Tier 2 population category last year); and Sioux Falls, South Dakota-Minnesota. Among Tier 3 areas with populations between 50,000 and 200,000, Sioux City, Iowa-Nebraska-South Dakota (Siouxland) returns to a familiar spot atop the rankings with 23 projects, just ahead of upstart Grand Forks, North Dakota-Minnesota, one of three North Dakota regions to make the top 10. Grand Forks tops the list of Top Tier 3 Metros by Projects Per Capita, followed by its fellow North Dakota city Minot. Six of the Top 10 in the Tier 3 Top Metros by Projects and seven of the Top 10 Tier 3 Top Metros by Projects Per Capita did not make their respective Top 10s last year. In the magazine’s ranking of Top Micropolitans — cities of 10,000 to 50,000 people which cover at least one county — Williston, North Dakota (21 projects) topped the nation’s 543 micropolitan areas, taking over the No. 1 spot from No. 2 Findlay, Ohio (16 projects). Findlay’s fellow Ohio communities of Wooster, Fremont and Tiffin fill out the top five positions, part of a cohort of 20 Ohio micropolitans to make Site Selection’s top 100, attracting a collective 114 projects. Neighboring Kentucky had 13 micros make the list, followed by Georgia with 11. Twin Cities Atop Mississippi River CorridorIn this same issue, Minneapolis-St. Paul-Bloomington, Minnesota-Wisconsin, attracted record investment last year to help the region rank as the No. 1 metro areas along the entire length of the Mississippi River Corridor, based on 91 private-sector facility projects tracked over an 18-month period tracing back to July 2024. Interviews in this issue with area leaders and with Minnesota Gov. Tim Walz clarify the region’s and state’s economic momentum and resilience. St. Louis, Missouri-Illinois, comes in second with 45 projects, followed by Baton Rouge, Louisiana at No. 3 (22 projects). In the projects-per-capita category, Vicksburg, Mississippi, comes out on top, followed by Blytheville, Arkansas, and Union City, Tennessee. Complete charts of the March 2026 issue’s primary national rankings and regional rankings can be found below. Full charts and data can be found in the rankings stories posted at the magazine’s website, www.siteselection.com. Site Selection magazine, published by Conway Data Inc., delivers expansion planning information to a qualified circulation of 41,000 executives of fast-growing firms. Now in its 73nd year, Site Selection is also available via Site Selection Online. Headquartered in metro Atlanta (Peachtree Corners, Gwinnett County), Conway Data, publisher of Site Selection magazine and industry newsletters, in 2017 was recognized as Georgia International Small Business of the Year by the Atlanta Business Chronicle. Conway Data has been a trusted advisor to corporations, government economic development and investment promotion agencies around the world since 1954. Conway Data also manages the Industrial Asset Management Council. (Note: All circulation information is publisher’s own data unless otherwise specified). 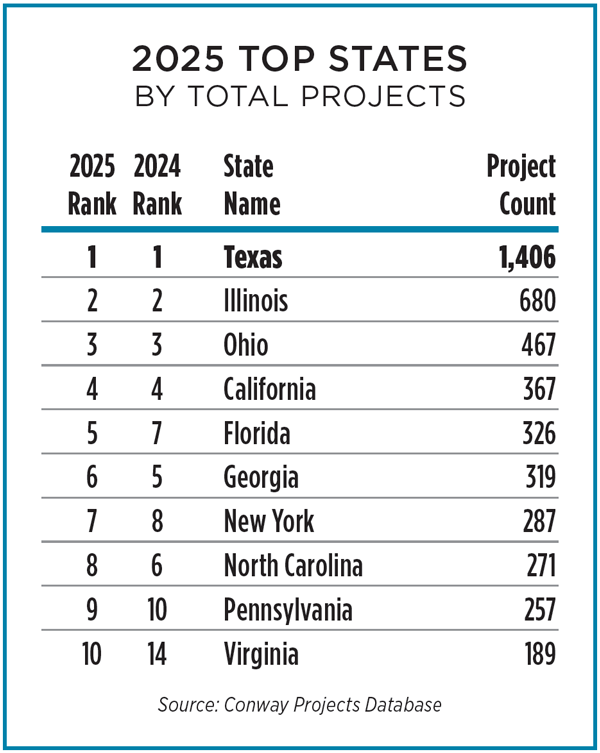 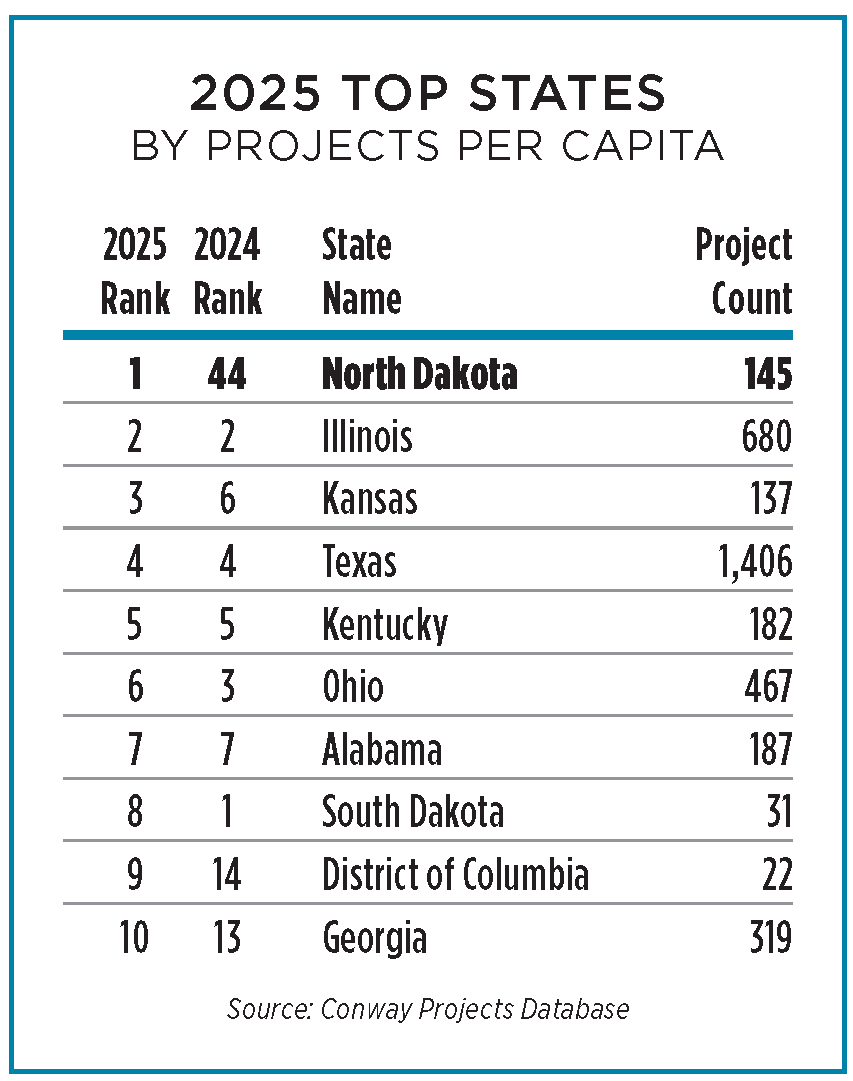 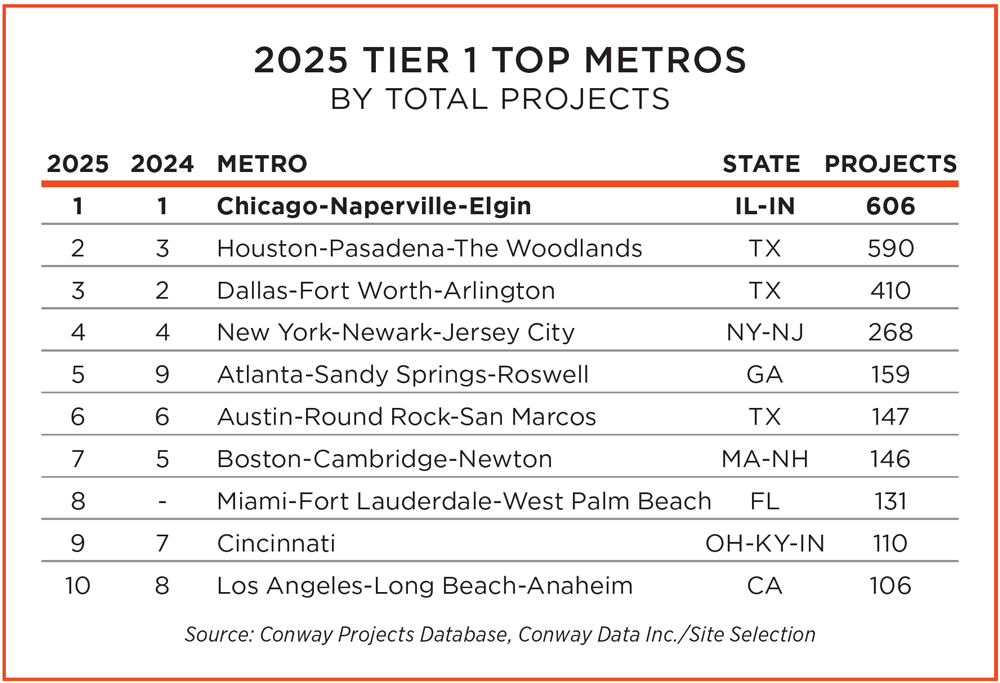 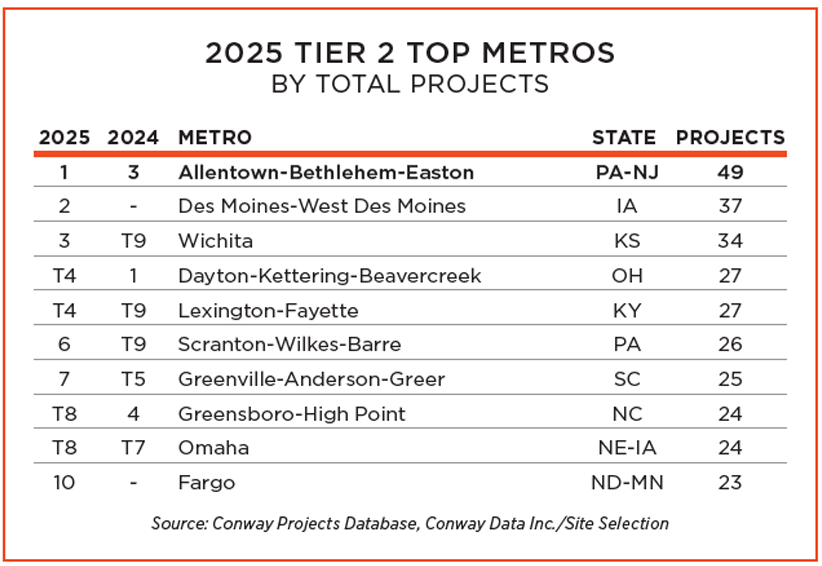 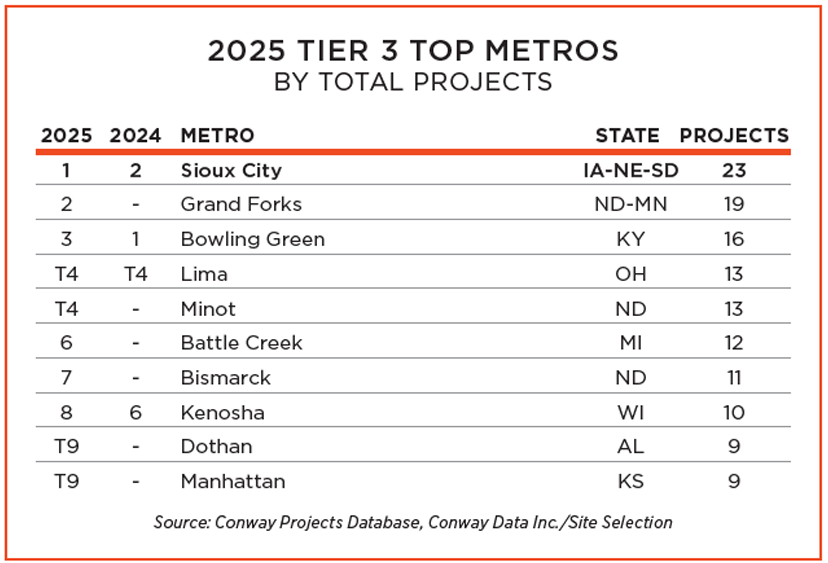 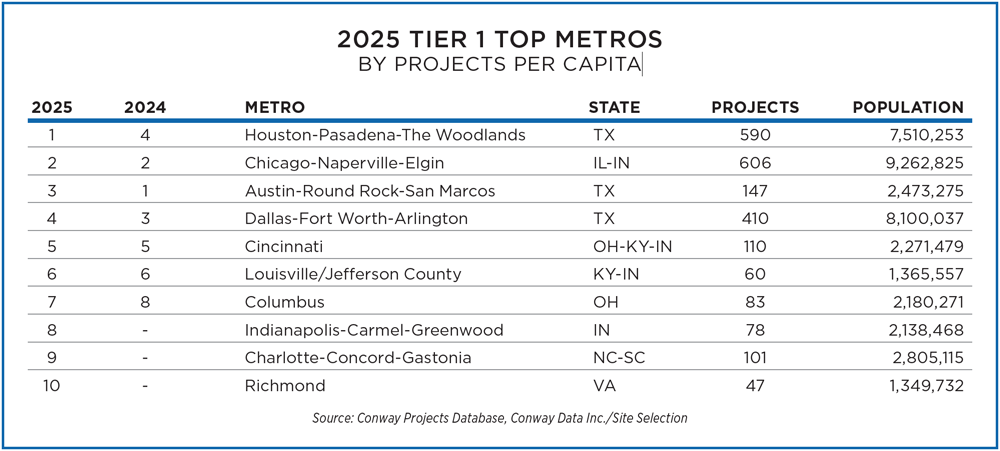 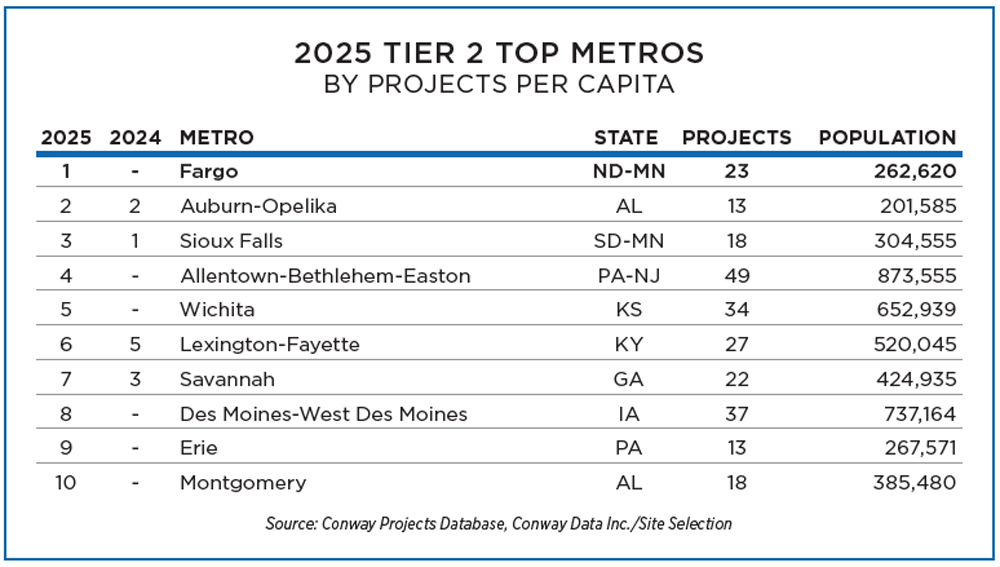 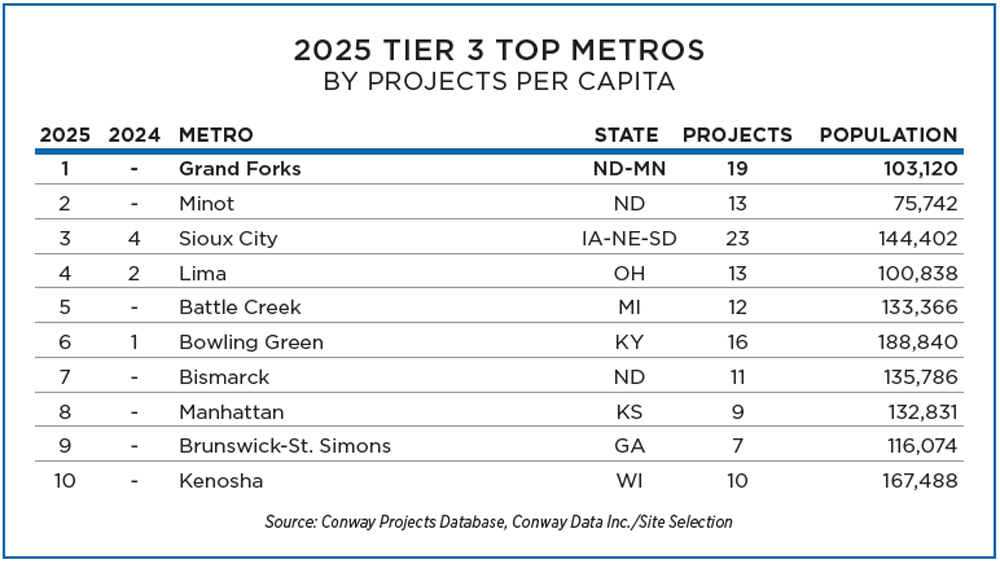 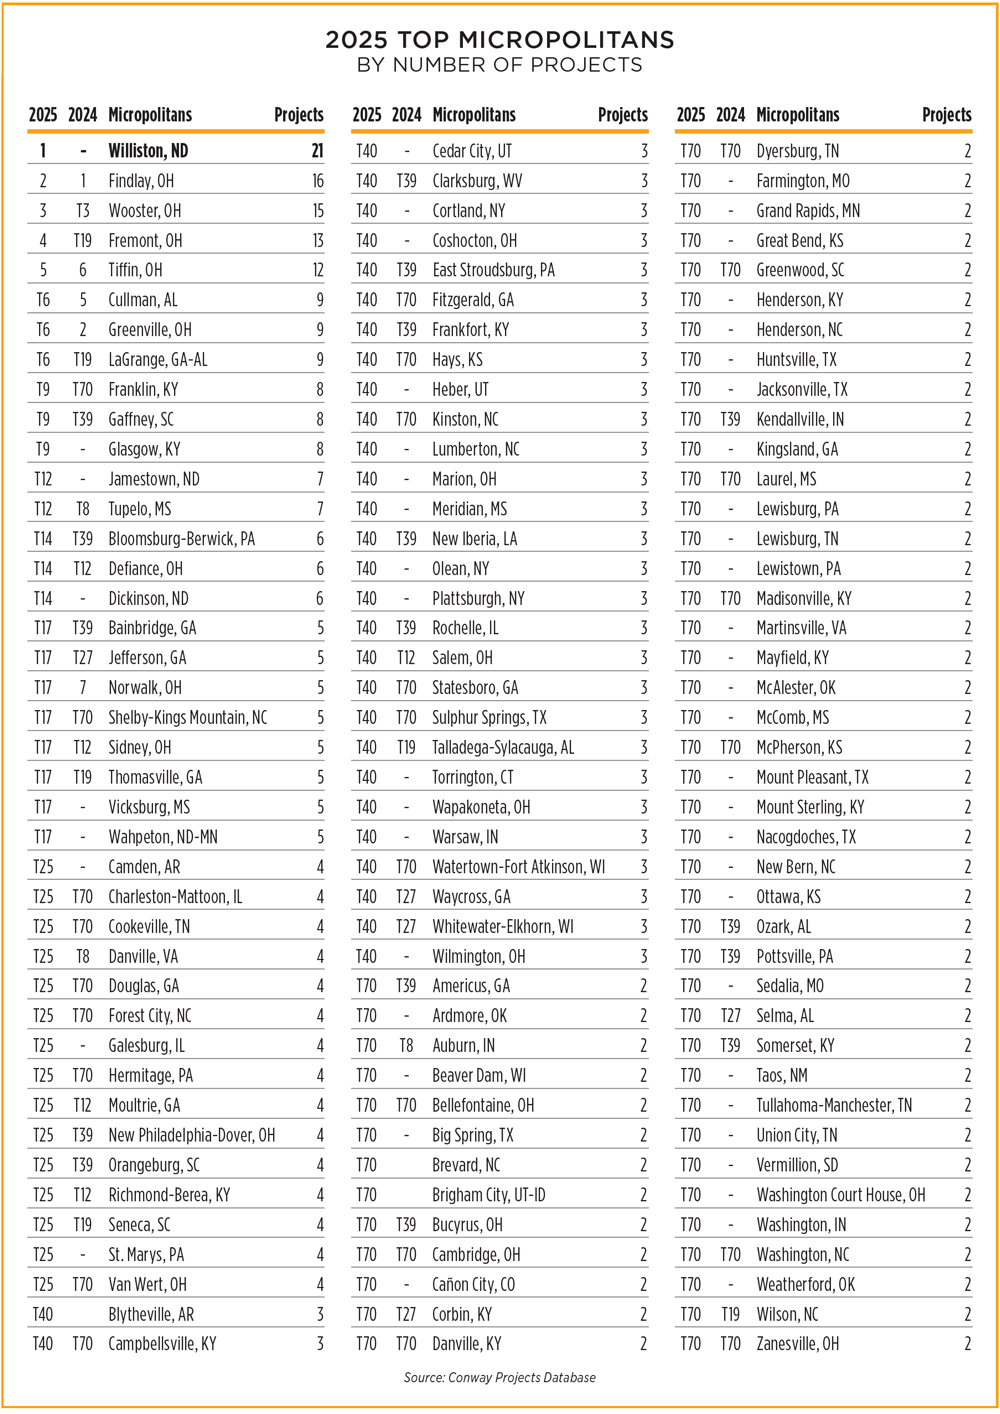 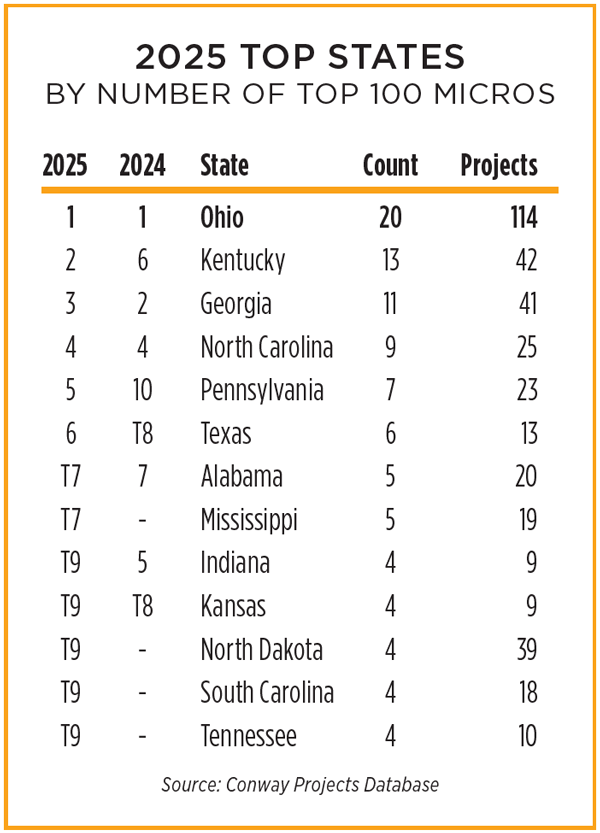 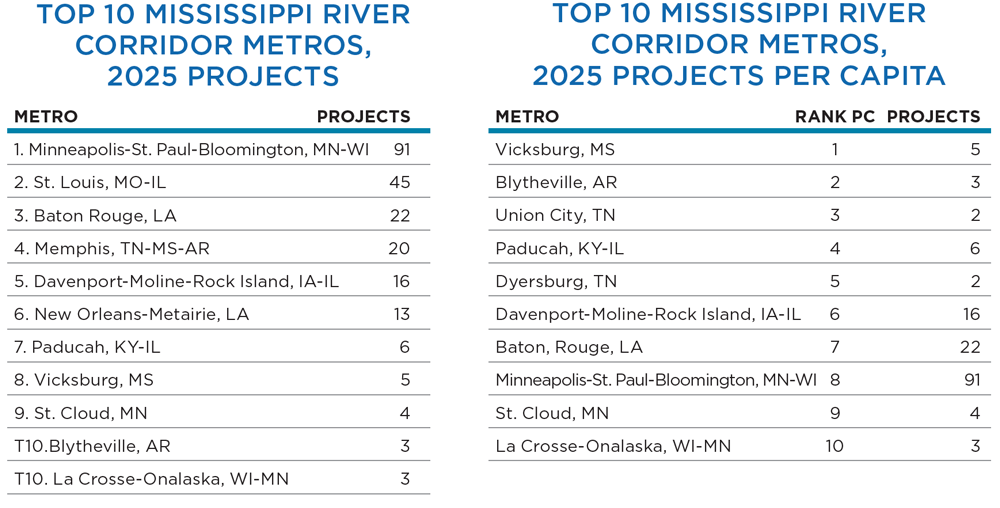 |
Press Release