
Business leaders in Puerto Rico appear to be the most optimistic in the latest Business Trends and Outlook Survey from the U.S. Census Bureau.
Photo of San Juan by Jacob Boomsma: Getty Images
It’s time for another chapter in Site Selection Snapshot’s occasional series on U.S. Census Bureau data sets useful to location decision-making.
Like a lag in your livestream, it can sometimes take a while for enormous data sets to catch up to the present. But even with a bit of a lag, a clearer picture eventually emerges. Some are from a few years back. But others — like the biweekly Business Trends and Outlook Survey (BTOS) that includes findings by NAICS code for all states and the country’s 25 most populous metro areas — are as fresh as last month, including insights into working from home.
The latest BTOS from February shows the nation’s strongest-performing sectors are finance and insurance; educational services; health care; arts and entertainment; and professional services.
Which of those 25 metros have businesses seeing the most chance of an increase in number of employees over the next six months? Portland, Oregon; San Diego, California; Minneapolis-St. Paul, Minnesota; Seattle, Washington; and Charlotte, North Carolina, appear to have the sunniest dispositions.
Downloading full survey response data from those 25 MSAs allows for sorting by level of response. Sometimes the responses are a mixed bag: Nineteen percent of Charlotte business respondents had seen an increase in demand for their products and services over the previous two weeks, but just over 20% saw a decrease.
The latest survey’s strongest responses relate to businesses being affected by weather events, including hurricane damage in Tampa; snow or blizzards in the nation’s capital region, Dallas-Fort Worth, Atlanta and Portland; and wildfires in Los Angeles. (Notably, the percentage of businesses citing monetary losses from snow in Denver, where they’re used to such things, was much lower than in such locations as Washington, D.C., and Atlanta.)
Asked whether they anticipated using AI in producing goods or services in the next six months, the highest “Yes” response rates (all in the teens) came from Denver, San Francisco, Seattle, Miami and San Diego.
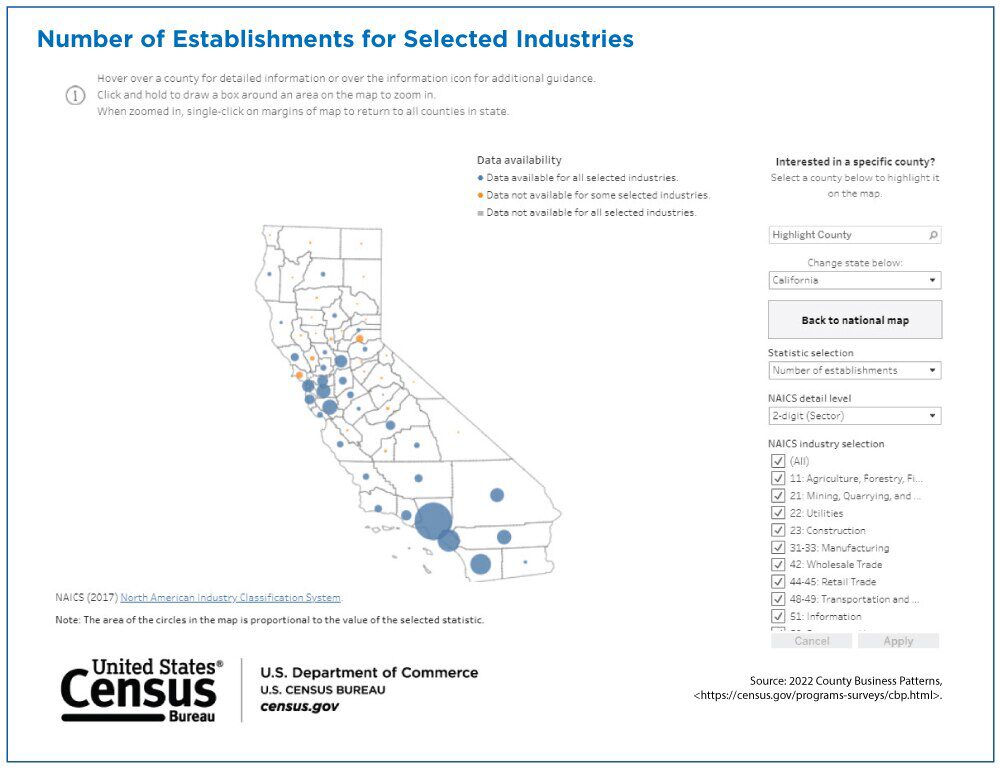
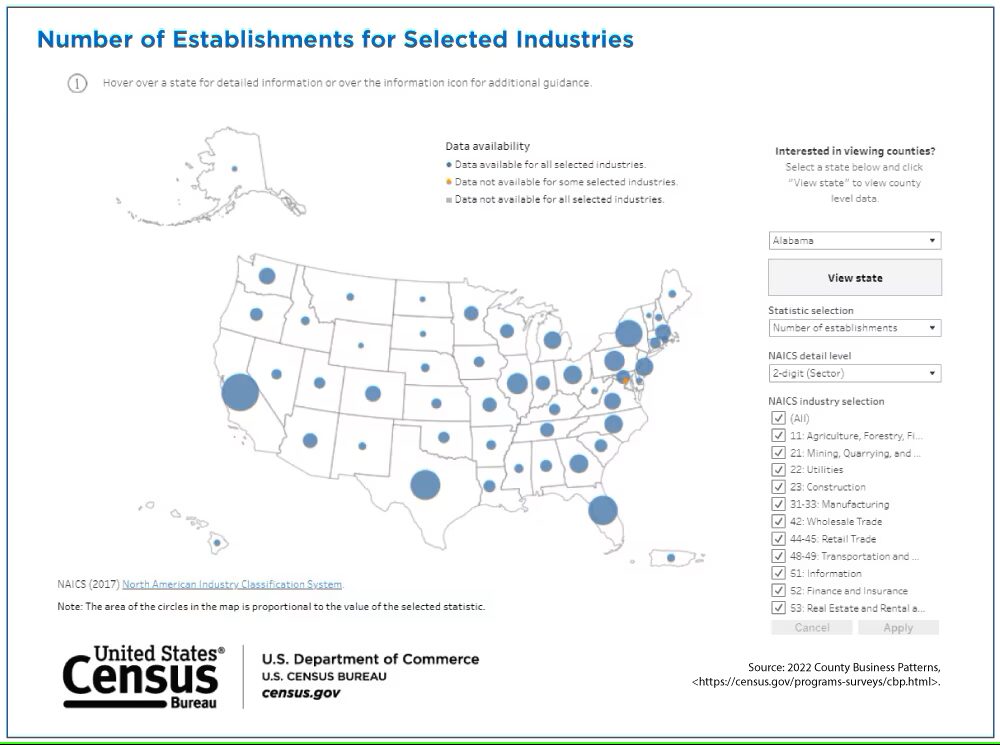
Explorers of Census Bureau County Business Patterns data can choose a state and compare statistics between counties.
Infographic courtesy of U.S. Census Bureau
By state or territory, asked to describe current business performance, the highest percentage responding “excellent” came from Puerto Rico, at 24.9%, a continuation of positive assessments going back a number of months. Mississippi and Nebraska had the most positive respondents for “above average.” Asked to estimate how their numbers of employees will have changed six months from now, more than 20% of employers in Alaska (27.8%), New Hampshire (27%), Wyoming (24.8%), Tennessee (22.5%) and South Dakota (21.8%) foresee an increase. Moreover, over 35% of respondents in Wyoming, New Hampshire and Alaska foresee increased demand for their products or services in the next six months as well.
The states with the highest percentage of business leaders responding “yes” to whether any paid employees worked from home during the preceding two weeks were led by D.C. (64.7%), Colorado (39.9%), Maryland (39.4%), Minnesota (38.5%) and Washington (36.6%).
As for data sets looking further back in time, in December the Bureau released new national, state and local economic data from the 2022 Economic Census. For the first time, the Geographic Area Statistics were made available in a single release — every sector and geography published at the same time. In addition to such sectors as manufacturing; mining, quarrying and oil and gas extraction; and finance and insurance, the data release also included measurements of the agriculture industry subsector for the first time in 45 years.
“These statistics provide the standard on industry and economic activity across states, counties and local areas that are used for economic development and regional planning, business location and investment decisions, and informed policy development,” said Nick Orsini, associate director for Economic Programs at the Census Bureau. Inadvertently summarizing one of the core missions of Site Selection, he continued, “Connecting industry information to geographic locations across the United States helps us better understand the economic changes taking place within the country.”
A few top-line findings:
- In 2022, 8 million employer establishments generated $50.5 trillion in sales, employing 136.6 million people with $8.5 trillion in annual payroll in the United States.
- “California and Texas were the top states for the number of establishments, employees, sales, and annual and first quarter payroll. Florida, New York and Illinois rounded out the top five states across each of these statistical variables from the 2022 Economic Census.
- The Wholesale Trade sector had the highest value of sales ($11.9 trillion) in the nation, with 29% of sales coming from California and Texas.”
- “Manufacturing was the second largest sector in the nation in terms of value of shipments at $7.0 trillion. In addition to California and Texas, Ohio, Indiana and Illinois each had over $300 billion in value of shipments from the Manufacturing sector.”
- “Michigan had 36,176 employees in Motor Vehicle Manufacturing (NAICS 3361), the most of any state, followed by California (24,163) and Kentucky (23,327).”
That release followed an October release of data tracking county business patterns showing where the most business activity is occurring. —Adam Bruns
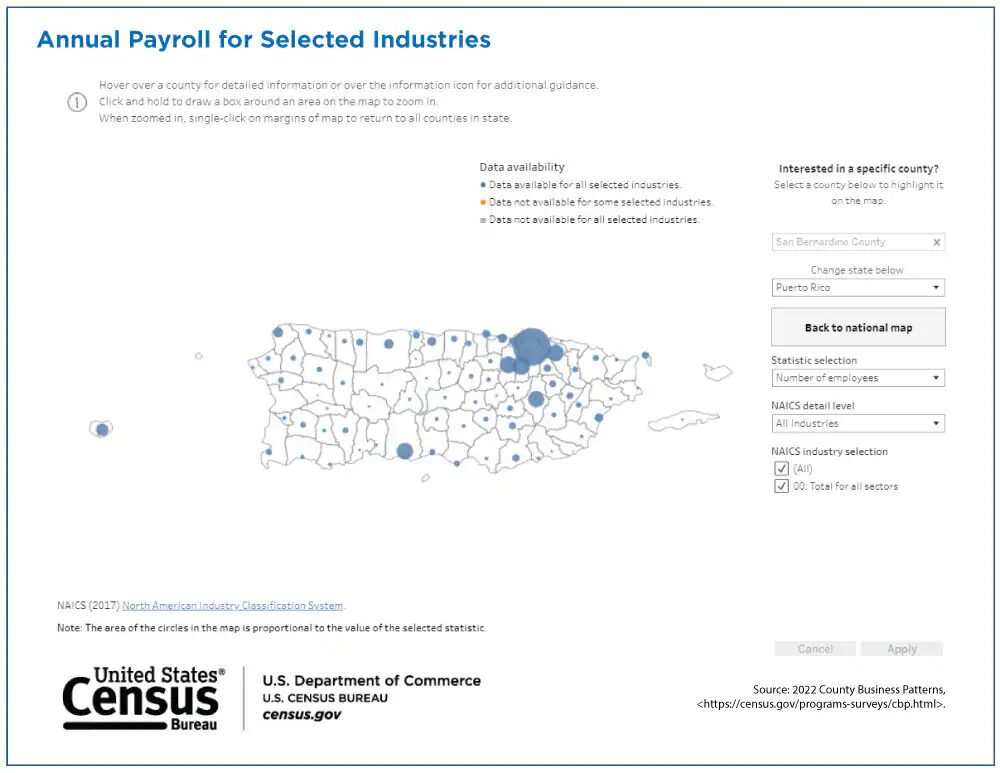
Selecting “Annual Payroll ($1,000)” and “All Industries” for Puerto Rico from the Census Bureau’s County Business Patterns data tool reveals that San Juan Municipio had the largest annual payroll ($7.7 billion) of all the municipios.