
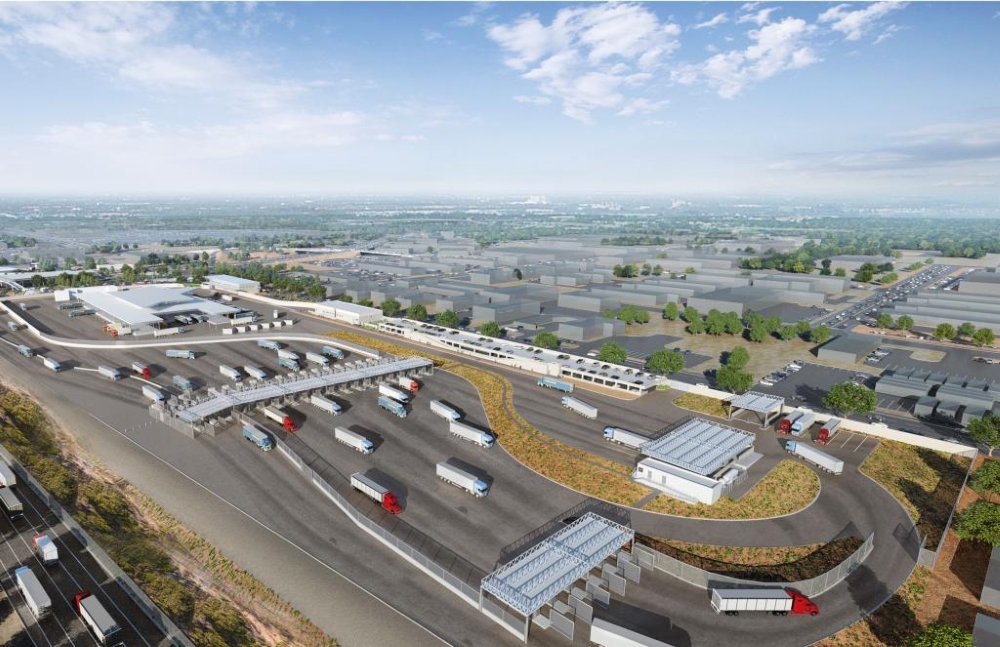
A ‘Determinants and Drivers’ model aids in identifying industry sector fits in six binational regions.
by CARL QUESINBERRY, AVISON YOUNG
For too long the U.S.–Mexico border has been discussed as one continuous market. It is not — it is a chain of matched binational systems with different determinant profiles, labor structures, modal strengths and risk signatures. The analytical backbone of this framework — the Determinants and Drivers model — is drawn from my 2025 Avison Young whitepaper, “Location Strategy and Site Selection for the New U.S. Industrial Economy,” which establishes the Two-Phase Location Planning Model and Trust Loop as the standard for disciplined industrial site selection across North America.
Determinants are the fixed, pass-fail facts: power, land, water, labor depth, logistics infrastructure, fiber, and permitting. Drivers are the moving signals: tariffs, USMCA usage, nearshoring, automation, and sector demand. Strong drivers cannot rescue a corridor that fails on determinants — they only amplify one that is already viable.
Since 2016, U.S. goods trade with Mexico has grown from $523.7 billion to $872.8 billion — a 67% increase. Most people read that headline and think, “Great, pick any border market and go.”
That is the wrong conclusion.

Photo: Getty Images by Jeremy Poland
The border got larger AND more segmented. The corridors that won didn’t win because of marketing. They won because their determinants matched the sector. The corridors that disappointed capital didn’t fail because Mexico failed — they failed because the wrong corridor was chosen for the wrong operating model.
So far in 2026, USMCA compliance is increasing, as non-compliant tariff friction increases. Freight concentration is holding, and the penalty for choosing the wrong corridor is rising — not falling. Laredo retains dominant inland gateway status with no challenger at scale.
Otay Mesa East is advancing with a $150 million federal grant. Brownsville energy and aerospace momentum are strengthening. Juárez/Tijuana softness is offset by a stronger Nuevo Laredo/Reynosa. In other words, one trend line does not describe the whole border.
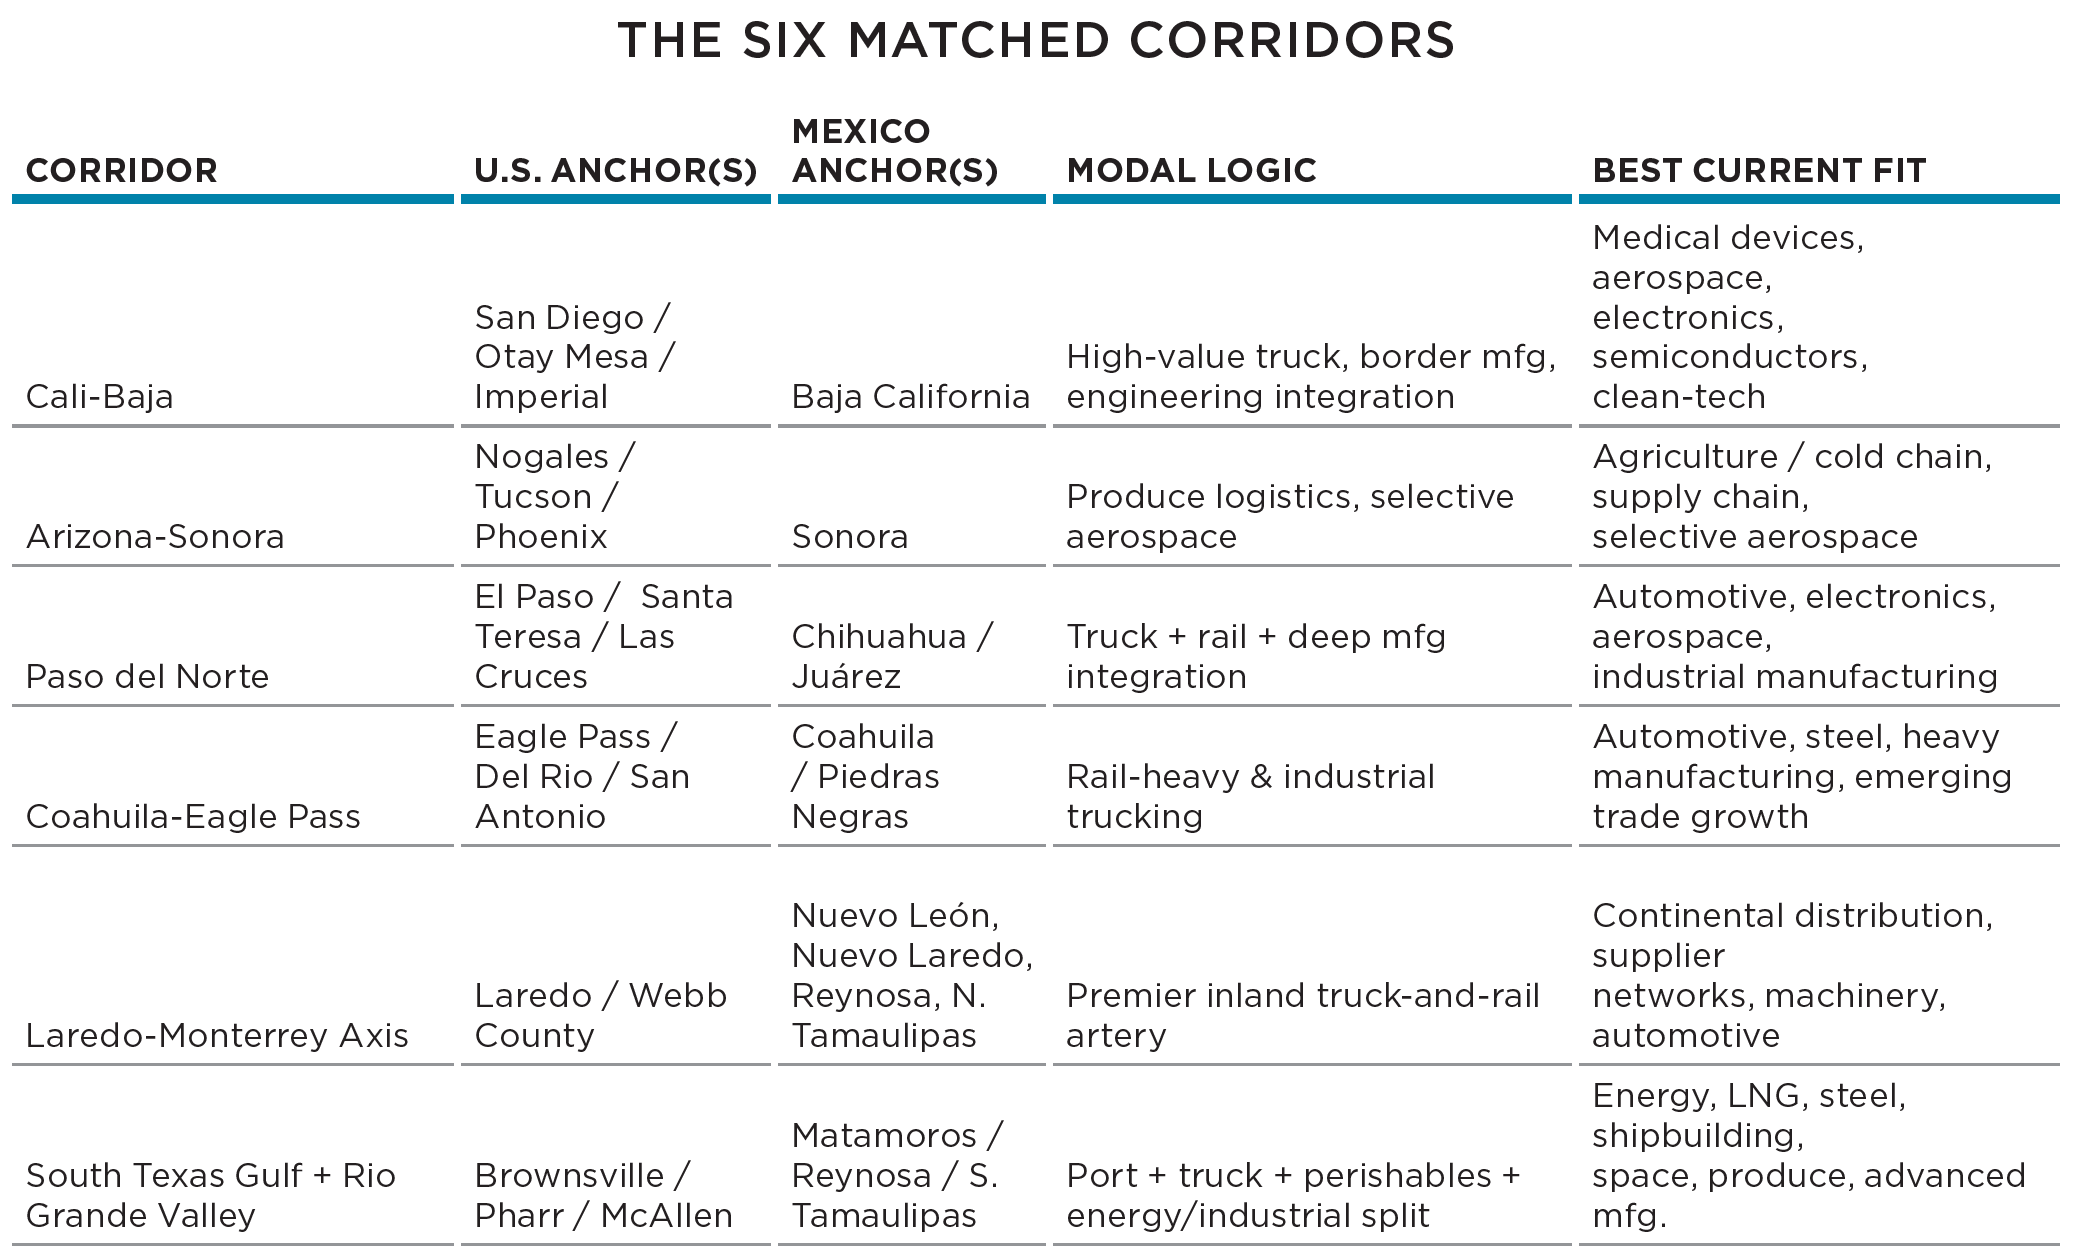
Chart courtesy of Avison Young
Highlights by Corridor
Cali-Baja: A $34.5 billion cross-border economy supporting ~95,000 local jobs. Best-in-class for medical devices, semiconductors, aerospace and clean-tech.
Arizona–Sonora: Nogales is one of North America’s defining produce gateways (~120,000 trucks/year, ~$2.5 billion in fresh produce). Sonora adds aerospace depth: avionics, engine components, wiring harnesses. Works best when the operating thesis rewards expertise over mass.
Paso del Norte: One of North America’s most integrated manufacturing systems. Hunt Institute Nov. 2025 data showed Juárez manufacturing employment down 2.8% year over year. Programs sensitive to labor tightness. Must ask harder questions than the market required a decade ago.
Coahuila–Eagle Pass: Eagle Pass is a top rail connection port — decisive for automotive, metals, steel and heavy industrial supply chains. Coahuila leads northern Mexico with 14% automotive manufacturing market share.
Laredo–Monterrey: 2.95 million inbound trucks in 2025 — 38.8% of the national total. 50 million+ sq. ft. of logistics space, two Class I railroads, broad FTZ footprint. Power is scale, throughput and industrial optionality — not automatically the best med-tech, aerospace, or produce answer.
South Texas Gulf + Rio Grande Valley: Brownsville is the only deepwater seaport on the Texas–Mexico border — $12 billion economic impact, energy, LNG, shipbuilding, aerospace momentum. Pharr: $46 billion+ in Reynosa manufacturing crosses a single bridge (96%+ of total trade value). Treating the Valley as one corridor leads to poor decisions.