
We’ve opened legislative documents. We’ve scrolled through pages of gubernatorial newsrooms. We’ve searched summaries of legislative sessions in capital cities from Bismarck to Tallahassee, all in order to present Site Selection’s annual State of the States report.
This report was compiled, edited and designed by Mark Arend, Kelly Barraza, Adam Bruns, Alexis Elmore, Ron Starner, Karen Medernach, Daniel Boyer, McKenzie Wright, Brian Espinoza and Richard Nenoff.
In the following pages, you’ll find demographic, GDP and credit rating insights, legislative and policy updates, agency information, governor quotes and, in some cases, “Project Watch” spotlights* that shed light on the economies, workforce and business climates of all 50 states. You’ll also find our “Rankings that Matter,” which include each state’s rank in the following economic development yardsticks:
| The Tax Foundation’s 2026 State Tax Competitiveness Index (Nov. 2025) | |
2023 Higher Education R&D Expenditure (Dollars in thousands), according to the National Center for Science and Engineering Statistics, Higher Education Research and Development Survey | |
Percent improvement in ACT National Career Readiness Certificates earned by working-age adults between October 2024 – October 2025 | |
Workers’ Compensation Premium Rate state rankings by the Oregon Department of Consumer and Business Services’ IT and Research Division (June 2025 – Biannual Report) | |
U.S. Energy Information Administration, Lowest Industrial Electric Power Cost (¢/kWh, 2024) | |
Fiscal Health (based on data from Pew Charitable Trusts’ Fiscal 50 resource) |
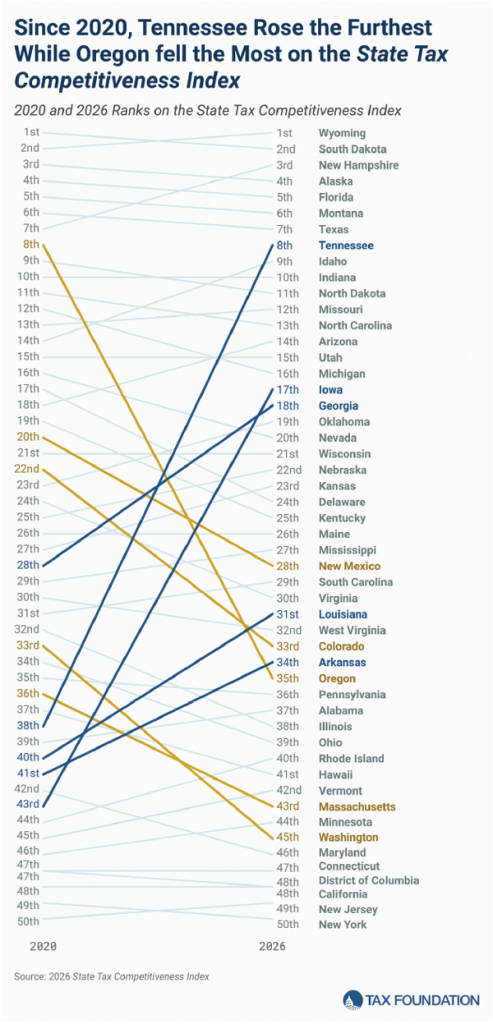
Among the economic development themes being pursued under capitol domes nationwide: workforce housing and child care, career and technical education and training, industrial site readiness, tourism and sports, and tax reform. The graph on this page from the Tax Foundation illustrates how all 50 states have progressed (or not) in the organization’s annual State Tax Competitiveness Index.
Sources: Standard & Poor’s (state credit ratings; ICR: issuer credit rating; All other ratings are for the state’s general obligation debt. Ratings for other debt issued by the state will vary based on the security backing the bonds. N.R.:Not rated); National Right to Work Legal Defense and Education Foundation, Inc.; The Pew Charitable Trusts Fiscal 50 resource; National Science Foundation; ACT; U.S. Energy Information Administration; U.S. Bureau of Labor Statistics; Tax Foundation; C2ER; National Bureau of Economic Research; U.S. Census Bureau; Oregon Department of Consumer and Business Services (workers’ comp rates); Conway Projects Database; state chambers of commerce, economic development agencies and business/industry associations; press reports; governors’ and corporate press rooms; law firms; Ballotpedia.org; and legislative research services.